HOT TOPICS LIST
- MACD
- Fibonacci
- RSI
- Gann
- ADXR
- Stochastics
- Volume
- Triangles
- Futures
- Cycles
- Volatility
- ZIGZAG
- MESA
- Retracement
- Aroon
INDICATORS LIST
LIST OF TOPICS
PRINT THIS ARTICLE
by David Penn
Negative divergences in the US Dollar Index suggest a pullback and potential test of the May lows.
Position: N/A
David Penn
Technical Writer for Technical Analysis of STOCKS & COMMODITIES magazine, Working-Money.com, and Traders.com Advantage.
PRINT THIS ARTICLE
REVERSAL
Divergences In The Dollar
07/06/06 08:45:08 AMby David Penn
Negative divergences in the US Dollar Index suggest a pullback and potential test of the May lows.
Position: N/A
| Many traders--even technical traders--like to conduct their analysis within a broader context. For some, this broader context is monetary policy, for others it is sector analysis and the business cycle, while for others still more esoteric contexts such as cycles analysis or Elliott wave are the preferred setting for their technical work. For me, it is a combination of things, starting with a "secular bull" or "secular bear" macro outlook followed up with a battery of cycles, sentiment, Elliott wave, and old-fashioned, classic "Edwards and Magee" technical analysis. |

|
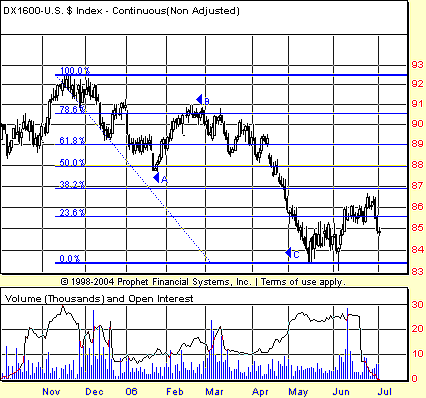
| FIGURE 1: US DOLLAR INDEX, CONTINUOUS FUTURES, DAILY. The bounce in the greenback found resistance at the 38.2% retracement level. Nonetheless, with the most recent down leg reaching its ABC correction target, it is likely that the dollar again will test the 38.2% retracement level for resistance. |
| Graphic provided by: Prophet Financial, Inc. |
| |
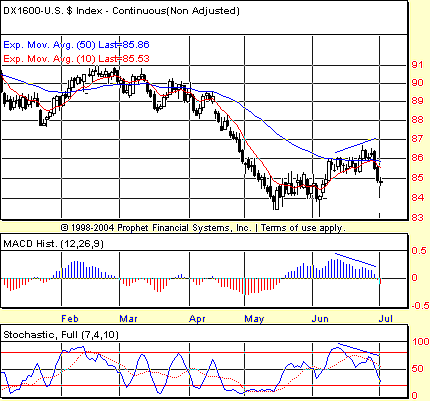
| I last wrote about the US Dollar index back in late May for Traders.com Advantage ("Dancing Days For The Dollar?" May 26, 2006). At the time, I pointed out that while the greenback had yet to bounce above the 38.2% retracement level during its May-June advance, the upside for the dollar was promising. This was based on cyclic analysis (Tim Wood at Cyclesman.com), as well as the positive technical divergences underscored in that May report. Since then, the US Dollar Index (basis continuous futures) has rallied from about 85 to more than 86.5 before slipping back below 85. It is worth remembering that the correction in the greenback that began in November 2005 and appears to have ended in May 2006 came in the wake of the greenback's strong rally out of the December 2004 lows. Recall that at the time, basis continuous futures, the greenback was trading near 81 and in little under a year would go on to rally to as high as 92. See Figures 1 and 2. |
| While the reversal to the downside in the dollar drew quite a bit of attention in days past, such thrills for dollar bears may be increasingly in short supply. Not only does the positive divergence in the stochastic suggest that a significant low was made in May, but the fact that the subsequent bounce has not yet retraced 38.2% of the previous decline means that either the bounce is extremely anemic, about to reverse and likely to lead to new lows ... OR that the bounce, as such, has only just begun. |

|
| FIGURE 2: US DOLLAR INDEX, CONTINUOUS FUTURES, DAILY. Negative divergences in both the MACD histogram and the stochastic suggest that a near-term top has developed in the greenback. Significant support at the 84 level awaits any decline that seeks to test it. |
| Graphic provided by: Prophet Financial, Inc. |
| |
| I am in the latter camp. In the November 2005-May 2006 bear market in the dollar, I see an ABC correction--mostly likely an Elliott wave zigzag--with some interesting price projections. As I wrote for Working Money recently ("The Case For New Highs," June 30, 2006), there are a number of ways of determining point C in an ABC correction. I take the A wave and multiply its length by 2, 1.618, and 0.618. That product is then subtracted from the high point of wave B to provide me with some reasonable targets to work with. |
| With a 2X multiple of A, we get 2 x 4 = 8. Eight subtracted from the high of wave B gives a downside target for wave C of 82. With a 1.618X multiple of A, we get 1.618 x 4 = 6.47. That product subtracted from the high of wave B gives a downside target for wave C of 83.53. I could do the 0.618 multiple as well as derive a projection from A=C. However, it is clear that with a closing low of 83.83 on May 12 (again, basis continuous futures) that the larger multiples of 2 and 1.618 have proven more accurate. This, by the way, dovetails with the commonsensical observation that, if the November 2005-May 2006 bear market was a countertrend move against the larger bull market that began in the greenback back in December 2004, then the November 2005-May 2006 decline was likely a zigzag in Elliott wave parlance. |
Technical Writer for Technical Analysis of STOCKS & COMMODITIES magazine, Working-Money.com, and Traders.com Advantage.
| Title: | Technical Writer |
| Company: | Technical Analysis, Inc. |
| Address: | 4757 California Avenue SW |
| Seattle, WA 98116 | |
| Phone # for sales: | 206 938 0570 |
| Fax: | 206 938 1307 |
| Website: | www.Traders.com |
| E-mail address: | DPenn@traders.com |
Traders' Resource Links | |
| Charting the Stock Market: The Wyckoff Method -- Books | |
| Working-Money.com -- Online Trading Services | |
| Traders.com Advantage -- Online Trading Services | |
| Technical Analysis of Stocks & Commodities -- Publications and Newsletters | |
| Working Money, at Working-Money.com -- Publications and Newsletters | |
| Traders.com Advantage -- Publications and Newsletters | |
| Professional Traders Starter Kit -- Software | |
Click here for more information about our publications!
Comments
Date: 07/07/06Rank: 2Comment:
Date: 07/12/06Rank: 4Comment:

Request Information From Our Sponsors
- StockCharts.com, Inc.
- Candle Patterns
- Candlestick Charting Explained
- Intermarket Technical Analysis
- John Murphy on Chart Analysis
- John Murphy's Chart Pattern Recognition
- John Murphy's Market Message
- MurphyExplainsMarketAnalysis-Intermarket Analysis
- MurphyExplainsMarketAnalysis-Visual Analysis
- StockCharts.com
- Technical Analysis of the Financial Markets
- The Visual Investor
- VectorVest, Inc.
- Executive Premier Workshop
- One-Day Options Course
- OptionsPro
- Retirement Income Workshop
- Sure-Fire Trading Systems (VectorVest, Inc.)
- Trading as a Business Workshop
- VectorVest 7 EOD
- VectorVest 7 RealTime/IntraDay
- VectorVest AutoTester
- VectorVest Educational Services
- VectorVest OnLine
- VectorVest Options Analyzer
- VectorVest ProGraphics v6.0
- VectorVest ProTrader 7
- VectorVest RealTime Derby Tool
- VectorVest Simulator
- VectorVest Variator
- VectorVest Watchdog
