HOT TOPICS LIST
- MACD
- Fibonacci
- RSI
- Gann
- ADXR
- Stochastics
- Volume
- Triangles
- Futures
- Cycles
- Volatility
- ZIGZAG
- MESA
- Retracement
- Aroon
INDICATORS LIST
LIST OF TOPICS
PRINT THIS ARTICLE
by Luis Ferro
From a technical point of view, gaps are important events that can provide clues to what the market is doing and where it might go in the near future. While they are easy to judge in hindsight, trying to interpret gaps in real time is much more difficult. Here's how to identify what type of gap occurred in cocoa and how it can be used for trading.
Position: N/A
Luis Ferro
Trader and technical analyst living in Bern, Switzerland. A full member of the STA, currently enrolled in the DITA program and the CMT program.
PRINT THIS ARTICLE
GAPS
Gap For Cocoa?
07/05/06 01:22:30 PMby Luis Ferro
From a technical point of view, gaps are important events that can provide clues to what the market is doing and where it might go in the near future. While they are easy to judge in hindsight, trying to interpret gaps in real time is much more difficult. Here's how to identify what type of gap occurred in cocoa and how it can be used for trading.
Position: N/A
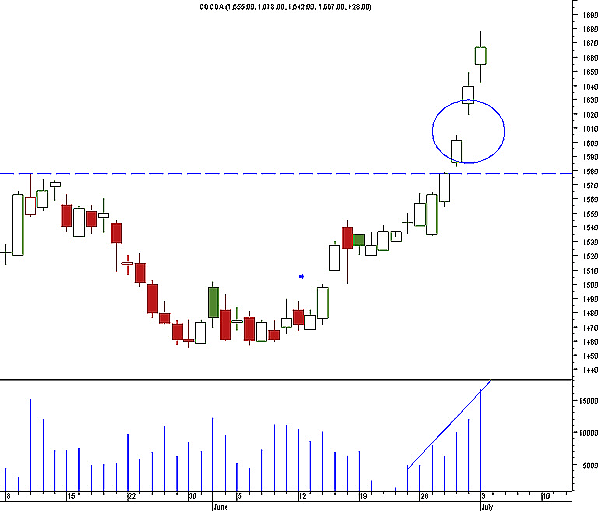
| After reaching a high of 1.578 on May 10, cocoa initiated a correction that brought prices down to 1.455. Following short-term congestion, an up gap occurred that marked the start of a new uptrend. Prices eventually broke above the previous high of 1.578, again with a gap, and on the following day an even stronger gap occurred (marked with a circle on Figure 1). It is this last gap that this article will try to identify. |

|
| FIGURE 1: COCOA, DAILY. This daily candlestick chart shows the gap and the rise in volume. |
| Graphic provided by: MetaStock. |
| |
| There are basically four types of gaps: area or common gap, breakaway gap, continuation gap, and exhaustion gap. The area gap is by far the most frequent type. It occurs typically when prices are in congestion areas and tends to close quickly. Volume can rise substantially on the day of the gap, but tends to return to normal levels in two or three days. This type of gap holds little interest for a trader because it has no predictive power. The breakaway gap is probably the most important type of gap from a trader's perspective, because its formation marks the beginning of a new trend. It normally occurs after a correction against the main trend or at the end of a congestion period. Because the positions in which breakaway and common gaps occur can be similar, it is often difficult to differentiate between them. Volume usually increases substantially in the day of the gap and remains high on the days following the gap. Any gap that occurs following a correction or congestion that does not show strong increase in volume should be regarded with suspicion because it can be an area gap. Besides volume, another important factor is that prices don't close the breakaway gap for a long time, while the common gap tends to close quickly. Therefore, it is sometimes better to wait for a few days before deciding what type of gap it is. But since the gap in cocoa occurred after a trending period, it can be neither an area nor a breakaway gap. |
| The other two types of gap are the continuation and the exhaustion. Continuation gaps are preceded by a trend, and after the gap, prices continue to progress in the direction of the previous trend. They are also known as measuring gaps, because many times the price movement following the gap is equal to the distance before the gap, and a price estimate is possible. Volume should be strong, causing prices to continue in the direction of the existing trend, and the gap should remain unclosed. The last type is the exhaustion gap and it precedes the end of the trend. Like the continuation gap, it occurs following a trending period, so it is often hard to differentiate between these two. In the case of the exhaustion gap, the trend is often much longer or stronger than normal. The gap itself may be unusually large (an important clue to interpret the gap) and volume can sometimes be well below average, but not always (although it can also be exceptionally high). This type of gap normally closes quickly. While the exhaustion gap normally marks the end of the trend, that does not mean that the trend will reverse; prices will enter a congestion area instead. In the case of cocoa, the gap can only be a continuation or an exhaustion gap. The trend preceding the gap is solid but not exceptionally strong. In terms of duration, it is also not very long, so the price action preceding the gap favors a continuation gap. Volume rose on the day of the gap, but not too much, and again on the day following the gap (an up day), suggesting that buyers are still being attracted. Only the size of this gap, which is bigger than normal for a continuation gap, weighs in favor of this being an exhaustion gap. Judging from the daily chart, it looks as if this is indeed a continuation gap, and since an exhaustion gap would not necessarily change the trend from up to down, the risk is much lower if one goes long. To trade a continuation gap, it is important to pay attention to the price action following the gap. If prices give any sign that the gap could be filled, the trader should exit immediately. |

|
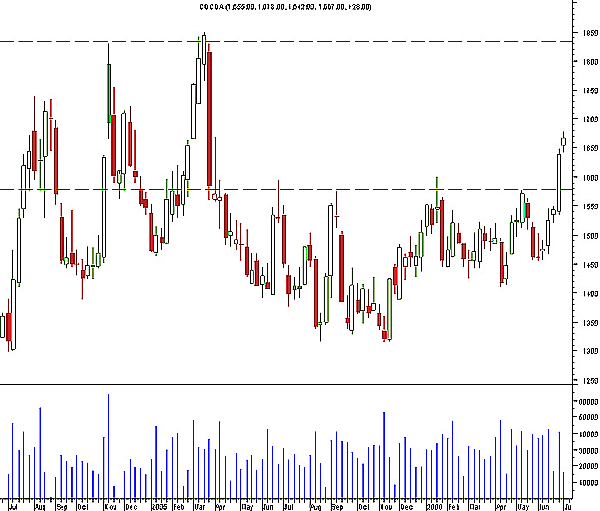
| FIGURE 2: COCOA, WEEKLY. This weekly chart of cocoa shows important support–resistance levels. |
| Graphic provided by: MetaStock. |
| |
| The weekly chart (Figure 2) shows the long-term movements of cocoa and a possible problem in assuming a long position. The high at 1.578 that was recently surpassed is an important long-term resistance level that has been tested many times. One important aspect of these levels is that many times, prices will pull back to the breakout level, which then will act as resistance before prices start to rise once more. This pullback has not yet occurred and is probably the greatest risk in taking a long position .The next resistance level is still far away at 1.830-1.850 and would be the most logical price target for a long position. The case of cocoa illustrates that even though gaps are essentially short-term patterns, it is always essential to check the long-term trend. |
Trader and technical analyst living in Bern, Switzerland. A full member of the STA, currently enrolled in the DITA program and the CMT program.
| Address: | Switzerland |
| E-mail address: | luispgsf@yahoo.com |
Click here for more information about our publications!
Comments
Date: 07/05/06Rank: 5Comment:

Request Information From Our Sponsors
- StockCharts.com, Inc.
- Candle Patterns
- Candlestick Charting Explained
- Intermarket Technical Analysis
- John Murphy on Chart Analysis
- John Murphy's Chart Pattern Recognition
- John Murphy's Market Message
- MurphyExplainsMarketAnalysis-Intermarket Analysis
- MurphyExplainsMarketAnalysis-Visual Analysis
- StockCharts.com
- Technical Analysis of the Financial Markets
- The Visual Investor
- VectorVest, Inc.
- Executive Premier Workshop
- One-Day Options Course
- OptionsPro
- Retirement Income Workshop
- Sure-Fire Trading Systems (VectorVest, Inc.)
- Trading as a Business Workshop
- VectorVest 7 EOD
- VectorVest 7 RealTime/IntraDay
- VectorVest AutoTester
- VectorVest Educational Services
- VectorVest OnLine
- VectorVest Options Analyzer
- VectorVest ProGraphics v6.0
- VectorVest ProTrader 7
- VectorVest RealTime Derby Tool
- VectorVest Simulator
- VectorVest Variator
- VectorVest Watchdog
