HOT TOPICS LIST
- MACD
- Fibonacci
- RSI
- Gann
- ADXR
- Stochastics
- Volume
- Triangles
- Futures
- Cycles
- Volatility
- ZIGZAG
- MESA
- Retracement
- Aroon
INDICATORS LIST
LIST OF TOPICS
PRINT THIS ARTICLE
by Arthur Hill
A look at the McClellan oscillator for the NYSE Composite iShares shows that the rally over the past week was the strongest of the year.
Position: Hold
Arthur Hill
Arthur Hill is currently editor of TDTrader.com, a website specializing in trading strategies, sector/industry specific breadth stats and overall technical analysis. He passed the Society of Technical Analysts (STA London) diploma exam with distinction is a Certified Financial Technician (CFTe). Prior to TD Trader, he was the Chief Technical Analyst for Stockcharts.com and the main contributor to the ChartSchool.
PRINT THIS ARTICLE
MCCLELLAN OSCILLATOR
McClellan Oscillator High For NYSE Composite
07/05/06 08:15:18 AMby Arthur Hill
A look at the McClellan oscillator for the NYSE Composite iShares shows that the rally over the past week was the strongest of the year.
Position: Hold
| The McClellan oscillator is a breadth indicator based on net advances (advances less declines). This version of the McClellan oscillator uses the percentage of net advances (AD net% = net advances divided by total issues). The McClellan oscillator is the 19-day exponential moving average (EMA) of AD net% less the 39-day EMA of AD net%. This indicator oscillates above and below the zero line. Signals are generated just like normal momentum oscillators by using divergences, centerline crossovers, and overbought/oversold readings. |

|
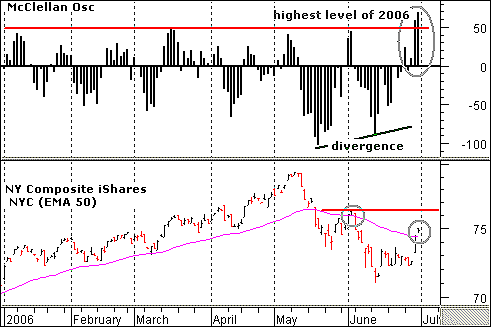
| FIGURE 1: NYSE COMPOSITE iSHARES. The McClellan oscillator formed a positive divergence over the last two months. |
| Graphic provided by: MetaStock. |
| |
| The McClellan oscillator formed a positive divergence over the last two months and last week moved to its highest level in 2006 (Figure 1). A positive divergence occurs when the indicator forms a higher low and the underlying security forms a lower low. The McClellan oscillator formed a higher low in June while the NYSE Composite iShares (NYC) formed a lower low. The higher low showed less selling pressure on the June decline and foreshadowed an important low. With a surge over the last five days, the indicator moved above 50, and this is clearly above-average buying pressure that could last. |
| Turning to the stock itself, we can see that NYC broke above the 50-day EMA for the second time in June (gray ovals). The first breakout failed immediately and the index moved to new lows. This breakout is only a day old and there is resistance around 76.5 from the early June high. Even though the McClellan oscillator shows serious buying pressure, the exchange traded fund (ETF) is too close to resistance and the 14-day stochastic oscillator is already trading above 80, which is overbought. This means that we are likely to see some backing and filling before continuing higher. |
Arthur Hill is currently editor of TDTrader.com, a website specializing in trading strategies, sector/industry specific breadth stats and overall technical analysis. He passed the Society of Technical Analysts (STA London) diploma exam with distinction is a Certified Financial Technician (CFTe). Prior to TD Trader, he was the Chief Technical Analyst for Stockcharts.com and the main contributor to the ChartSchool.
| Title: | Editor |
| Company: | TDTrader.com |
| Address: | Willem Geetsstraat 17 |
| Mechelen, B2800 | |
| Phone # for sales: | 3215345465 |
| Website: | www.tdtrader.com |
| E-mail address: | arthurh@tdtrader.com |
Traders' Resource Links | |
| TDTrader.com has not added any product or service information to TRADERS' RESOURCE. | |
Click here for more information about our publications!
Comments
Date: 07/05/06Rank: 4Comment:
Date: 07/11/06Rank: 5Comment:

Request Information From Our Sponsors
- StockCharts.com, Inc.
- Candle Patterns
- Candlestick Charting Explained
- Intermarket Technical Analysis
- John Murphy on Chart Analysis
- John Murphy's Chart Pattern Recognition
- John Murphy's Market Message
- MurphyExplainsMarketAnalysis-Intermarket Analysis
- MurphyExplainsMarketAnalysis-Visual Analysis
- StockCharts.com
- Technical Analysis of the Financial Markets
- The Visual Investor
- VectorVest, Inc.
- Executive Premier Workshop
- One-Day Options Course
- OptionsPro
- Retirement Income Workshop
- Sure-Fire Trading Systems (VectorVest, Inc.)
- Trading as a Business Workshop
- VectorVest 7 EOD
- VectorVest 7 RealTime/IntraDay
- VectorVest AutoTester
- VectorVest Educational Services
- VectorVest OnLine
- VectorVest Options Analyzer
- VectorVest ProGraphics v6.0
- VectorVest ProTrader 7
- VectorVest RealTime Derby Tool
- VectorVest Simulator
- VectorVest Variator
- VectorVest Watchdog
