HOT TOPICS LIST
- MACD
- Fibonacci
- RSI
- Gann
- ADXR
- Stochastics
- Volume
- Triangles
- Futures
- Cycles
- Volatility
- ZIGZAG
- MESA
- Retracement
- Aroon
INDICATORS LIST
LIST OF TOPICS
PRINT THIS ARTICLE
by Gary Grosschadl
This company, which focuses on infectious diseases and vaccines, has seen its stock reach an important support level.
Position: Buy
Gary Grosschadl
Independent Canadian equities trader and technical analyst based in Peterborough
Ontario, Canada.
PRINT THIS ARTICLE
DOUBLE TOPS
MedImmune Hits Double-Top Target
06/30/06 12:20:30 PMby Gary Grosschadl
This company, which focuses on infectious diseases and vaccines, has seen its stock reach an important support level.
Position: Buy
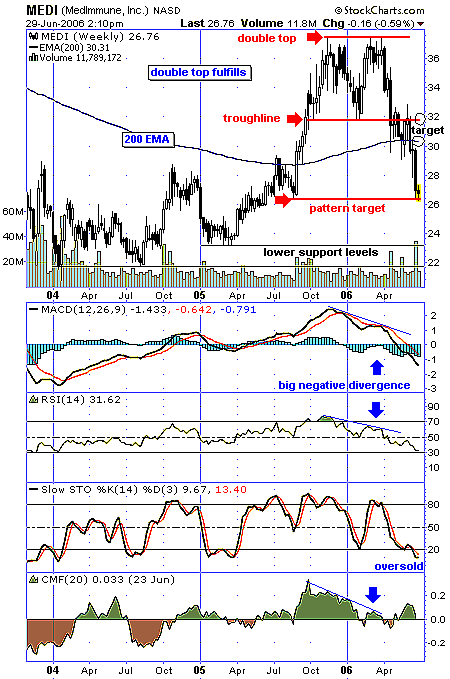
| As Figure 1 shows, the stock has undergone a double-top formation. The first peak was made in late 2005, and roughly six months later, the second peak was hit. A trendline was established with good symmetry at the $32 level. A double top officially came into play when the trendline was broken to the downside. Traders playing the formation were tested when the stock flirted for several weeks with the 200-period exponential moving average (EMA) just above $30. The stock finally succumbed, breaking under this support with a close under $30. Two weeks later, it came down to the double-top completion target of nearly $26. |
| This pattern fulfillment target is measured by a downside move below the trendline that is equal to the distance of the peak of the formation to the trendline. Note how the pattern target relates to an area of previous support close to the base of a very large candlestick. Large candlesticks often manifest support/resistance at either midpoints or endpoints of their real bodies. |

|
| FIGURE 1: MEDI, WEEKLY. This stock has undergone a double-top formation. |
| Graphic provided by: StockCharts.com. |
| |
| Several indicators reflect very obvious negative divergences to the stock's price action. When the stock reached its second peak, note how much lower the peaks were on those indicators: the moving average convergence/divergence (MACD), the relative strength index (RSI), and the Chaikin money flow (CMF). Negative divergences like this often point to an approaching downleg or correction. |
| Now that the pattern has hit its target, upside and downside targets must be contemplated. A bounce attempt here is very likely. The upside targets are suggested at or near the 200-period exponential moving average (EMA) and the trendline (roughly $30-32). With enough bullishness, the longer-term target could retest the previous double top. If for any reason the bear drive is renewed below the current "floor," the next support targets could reach $23 or $22, relating to previous lower support levels. |
Independent Canadian equities trader and technical analyst based in Peterborough
Ontario, Canada.
| Website: | www.whatsonsale.ca/financial.html |
| E-mail address: | gwg7@sympatico.ca |
Click here for more information about our publications!
Comments
Date: 07/01/06Rank: 5Comment:

|

Request Information From Our Sponsors
- StockCharts.com, Inc.
- Candle Patterns
- Candlestick Charting Explained
- Intermarket Technical Analysis
- John Murphy on Chart Analysis
- John Murphy's Chart Pattern Recognition
- John Murphy's Market Message
- MurphyExplainsMarketAnalysis-Intermarket Analysis
- MurphyExplainsMarketAnalysis-Visual Analysis
- StockCharts.com
- Technical Analysis of the Financial Markets
- The Visual Investor
- VectorVest, Inc.
- Executive Premier Workshop
- One-Day Options Course
- OptionsPro
- Retirement Income Workshop
- Sure-Fire Trading Systems (VectorVest, Inc.)
- Trading as a Business Workshop
- VectorVest 7 EOD
- VectorVest 7 RealTime/IntraDay
- VectorVest AutoTester
- VectorVest Educational Services
- VectorVest OnLine
- VectorVest Options Analyzer
- VectorVest ProGraphics v6.0
- VectorVest ProTrader 7
- VectorVest RealTime Derby Tool
- VectorVest Simulator
- VectorVest Variator
- VectorVest Watchdog
