HOT TOPICS LIST
- MACD
- Fibonacci
- RSI
- Gann
- ADXR
- Stochastics
- Volume
- Triangles
- Futures
- Cycles
- Volatility
- ZIGZAG
- MESA
- Retracement
- Aroon
INDICATORS LIST
LIST OF TOPICS
PRINT THIS ARTICLE
by David Penn
The resolution of a 1-2-3 trend reversal is a 200-point-plus breakout.
Position: N/A
David Penn
Technical Writer for Technical Analysis of STOCKS & COMMODITIES magazine, Working-Money.com, and Traders.com Advantage.
PRINT THIS ARTICLE
REVERSAL
The Dow Breakout: 1-2-3
06/30/06 08:04:21 AMby David Penn
The resolution of a 1-2-3 trend reversal is a 200-point-plus breakout.
Position: N/A
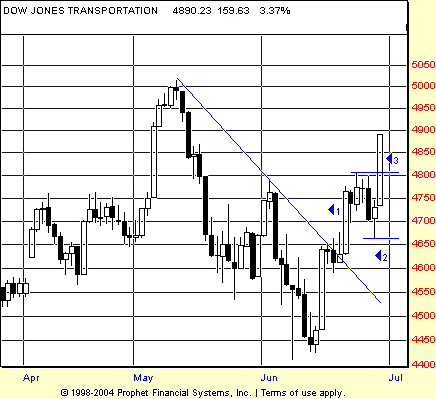
| I recently pointed out how the nonconfirmation between the Dow industrials and the Dow transports put a cloud over the once-confirmed downtrend ("Leading By Transports," June 29, 2006; Traders.com Advantage). To recap, the downtrend that began in May was confirmed when both the industrials and the transports broke down below the April lows. However, because the transports failed to break down below the March lows as the industrials did, there was a nonconfirmation that put into doubt the validity (or, better, the sustainability) of the downtrend (Figure 1). |

|
| FIGURE 1: DOW JONES TRANSPORTATION AVERAGE, DAILY. A classic 1-2-3 trend reversal sends the Dow transports soaring to new monthly highs, and closing in on all-time highs near 5,000. |
| Graphic provided by: Prophet Financial, Inc. |
| |
| The bounce from the June bottom brought both the industrials and the transports up above a downtrend line that can be cast from the May highs. I draw down trendlines the way that Victor Sperandeo suggests in his book Methods Of A Wall Street Master: from the highest high to the lowest high immediately preceding the lowest low. This provides for a reliable trendline, one that will be consistently drawn every time. |
| This kind of trendline is also key to a trading setup that Sperandeo refers to called the 1-2-3 trend reversal. The 1-2-3 trend reversal here was a relatively tight one. The "1" was the break above the downtrend line, while the "2" was the effort four sessions later to reassert the previous downtrend and to set a new low. The "3" of the 1-2-3 trend reversal came in a powerful, 200-point-plus fashion merely two days after step 2 occurred. |

|
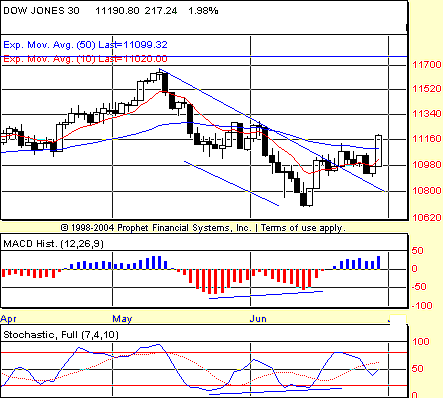
| FIGURE 2: DOW JONES INDUSTRIAL AVERAGE, DAILY. The 1-2-3 trend reversal in the industrials is backed up (as it is in transports, as well) by positive divergences in both the MACD histogram and the stochastic. |
| Graphic provided by: Prophet Financial, Inc. |
| |
| In the aforementioned article, I wrote about positive divergences in both the moving average convergence/divergence (MACD) histogram and the stochastic that suggested that a bottom of some significance was brewing in both the Dow industrials and transports. In another recent article, I suggested that the June lows had likely found support on the lower boundary of a trend channel that extends back to the lows of 2004 ("Channeling Bottoms," June 20, 2006; Traders.com Advantage). The successful trend reversal seems to underscore the validity of that support. (See Figure 2.) |
| What kind of upside can traders and speculators look for? My upcoming Working Money article, "The Case For New Highs," notwithstanding, the first task for the Dow industrials will be a close above the June highs near 11,270. Such a move would confirm the Dow transports, which set a new high for the month with the market surge on June 29. |
Technical Writer for Technical Analysis of STOCKS & COMMODITIES magazine, Working-Money.com, and Traders.com Advantage.
| Title: | Technical Writer |
| Company: | Technical Analysis, Inc. |
| Address: | 4757 California Avenue SW |
| Seattle, WA 98116 | |
| Phone # for sales: | 206 938 0570 |
| Fax: | 206 938 1307 |
| Website: | www.Traders.com |
| E-mail address: | DPenn@traders.com |
Traders' Resource Links | |
| Charting the Stock Market: The Wyckoff Method -- Books | |
| Working-Money.com -- Online Trading Services | |
| Traders.com Advantage -- Online Trading Services | |
| Technical Analysis of Stocks & Commodities -- Publications and Newsletters | |
| Working Money, at Working-Money.com -- Publications and Newsletters | |
| Traders.com Advantage -- Publications and Newsletters | |
| Professional Traders Starter Kit -- Software | |
Click here for more information about our publications!
Comments
Date: 07/01/06Rank: 3Comment:

Request Information From Our Sponsors
- VectorVest, Inc.
- Executive Premier Workshop
- One-Day Options Course
- OptionsPro
- Retirement Income Workshop
- Sure-Fire Trading Systems (VectorVest, Inc.)
- Trading as a Business Workshop
- VectorVest 7 EOD
- VectorVest 7 RealTime/IntraDay
- VectorVest AutoTester
- VectorVest Educational Services
- VectorVest OnLine
- VectorVest Options Analyzer
- VectorVest ProGraphics v6.0
- VectorVest ProTrader 7
- VectorVest RealTime Derby Tool
- VectorVest Simulator
- VectorVest Variator
- VectorVest Watchdog
- StockCharts.com, Inc.
- Candle Patterns
- Candlestick Charting Explained
- Intermarket Technical Analysis
- John Murphy on Chart Analysis
- John Murphy's Chart Pattern Recognition
- John Murphy's Market Message
- MurphyExplainsMarketAnalysis-Intermarket Analysis
- MurphyExplainsMarketAnalysis-Visual Analysis
- StockCharts.com
- Technical Analysis of the Financial Markets
- The Visual Investor
