HOT TOPICS LIST
- MACD
- Fibonacci
- RSI
- Gann
- ADXR
- Stochastics
- Volume
- Triangles
- Futures
- Cycles
- Volatility
- ZIGZAG
- MESA
- Retracement
- Aroon
INDICATORS LIST
LIST OF TOPICS
PRINT THIS ARTICLE
by Luis Ferro
The head & shoulders in the Dow Jones Industrial Average is by far the most relevant technical factor in the short and medium term. In the long term there are still important support levels that will probably have strong influence in the future price movements of the index, but also bearish factors that are probably even more important.
Position: N/A
Luis Ferro
Trader and technical analyst living in Bern, Switzerland. A full member of the STA, currently enrolled in the DITA program and the CMT program.
PRINT THIS ARTICLE
CANDLESTICK CHARTING
DJIA Turns Bearish
06/29/06 01:20:55 PMby Luis Ferro
The head & shoulders in the Dow Jones Industrial Average is by far the most relevant technical factor in the short and medium term. In the long term there are still important support levels that will probably have strong influence in the future price movements of the index, but also bearish factors that are probably even more important.
Position: N/A
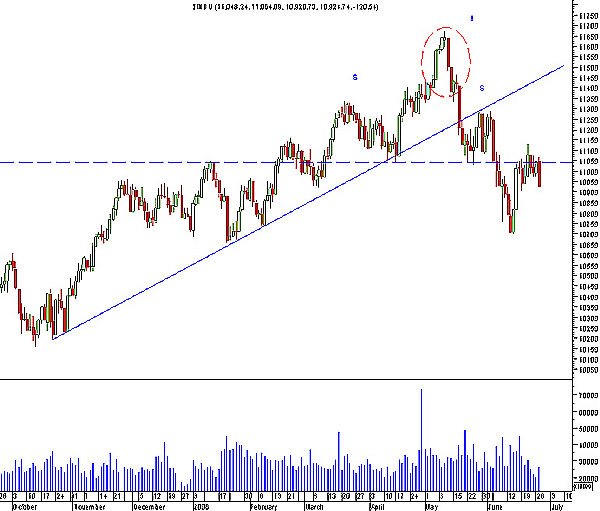
| The daily chart (Figure 1) shows the medium-term rally that began in October and took the Dow Jones Industrial Average (DJIA) from 10,156 to a high of 11,670 on May 10. At this point, a pattern known in Japanese candlestick terminology as a "towering top" (highlighted with a circle) developed and the DJIA initiated a sharp correction that brought it to the 10,700 level, a loss of 8.7% in a little more than one month. In the last two weeks, the DJIA recovered somewhat and has been fluctuating between the 10,900 and the 11,100 level. So has the correction ended or will the DJIA continue to fall? |

|
| FIGURE 1: DJIA, DAILY. The candlestick chart of the $INDU shows the tower top and head & shoulders. |
| Graphic provided by: MetaStock. |
| |
| The towering top pattern has three characteristics: first, one large (or more than one) bullish candlestick leading to the top. Second, at the top itself, there should be several small candlesticks--the color is unimportant. Finally, one or more large bearish candlesticks marks the beginning of a correction. The top resembles a tower and is generally considered a strong short-term pattern. The towering top in the DJIA coincided with the top of a more relevant head & shoulders pattern (the head and two shoulders are marked with letters on the chart, and the neckline is the dotted blue line). This pattern is probably the most reliable of all the classical reversal patterns and in the case of an Index like the DJIA, it is normally even more reliable than in the case of individual stocks. After crossing below the neckline, which is the line connecting the lows between the shoulders (marked with a dotted blue line), prices are usually expected to fall a minimum equal to the height of the pattern, which is the distance from the neckline to the highest point in the head. In the case of the DJIA, the height of the head & shoulders is 640 points and since the neckline is at approximately 11,040, the target for the correction would be at 10,400. Since the correction has not yet reached this level (the lowest point was 10,700) and since the DJIA has not crossed above the neckline (a fact that could invalidate the bearish forecast of this pattern), the head & shoulders must be considered valid. Therefore, from a technical point of view, the correction should be expected to continue with the DJIA reaching lower levels. |

|
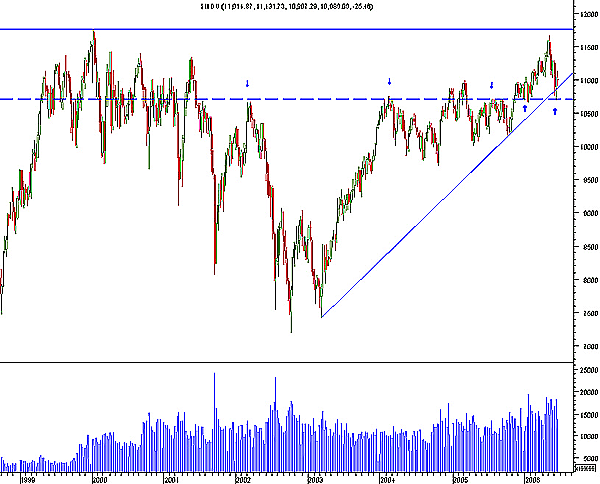
| FIGURE 2: DJIA, WEEKLY. This chart of the $INDU shows important support/resistance levels. |
| Graphic provided by: MetaStock. |
| |
| While the head & shoulders clearly dominate the medium-term forecast for the DJIA, there are a few reasons to be bullish when the long-term trend is considered. On the weekly chart (Figure 2), it is clear why the DJIA found support at 10,700 and the correction stopped. This was an important level that had acted as support/resistance before, and those levels derive their relevance both from the number of times that they have acted as such in the past and how long ago it occurred. At the same time, a rising trendline also provided a source of support at 10,700. This is an important long-term trendline, and crossing below it will not be easy. |
| But the long-term chart also shows that there has been no significant correction since the long-term rally started in 2003. At this point, the rally is probably overextended (I personally don't like the term overbought) and therefore vulnerable. There is also a critical bearish technical factor in the long-term chart. The high at 11,670 in May was very close to the historical top of the DJIA at 11,750. The psychological effect of such an important resistance level, on what is probably the most followed index, is very strong. These two long-term bearish factors are probably enough to turn the market from bullish to bearish. |
Trader and technical analyst living in Bern, Switzerland. A full member of the STA, currently enrolled in the DITA program and the CMT program.
| Address: | Switzerland |
| E-mail address: | luispgsf@yahoo.com |
Click here for more information about our publications!
Comments
Date: 06/29/06Rank: 3Comment:

Request Information From Our Sponsors
- StockCharts.com, Inc.
- Candle Patterns
- Candlestick Charting Explained
- Intermarket Technical Analysis
- John Murphy on Chart Analysis
- John Murphy's Chart Pattern Recognition
- John Murphy's Market Message
- MurphyExplainsMarketAnalysis-Intermarket Analysis
- MurphyExplainsMarketAnalysis-Visual Analysis
- StockCharts.com
- Technical Analysis of the Financial Markets
- The Visual Investor
- VectorVest, Inc.
- Executive Premier Workshop
- One-Day Options Course
- OptionsPro
- Retirement Income Workshop
- Sure-Fire Trading Systems (VectorVest, Inc.)
- Trading as a Business Workshop
- VectorVest 7 EOD
- VectorVest 7 RealTime/IntraDay
- VectorVest AutoTester
- VectorVest Educational Services
- VectorVest OnLine
- VectorVest Options Analyzer
- VectorVest ProGraphics v6.0
- VectorVest ProTrader 7
- VectorVest RealTime Derby Tool
- VectorVest Simulator
- VectorVest Variator
- VectorVest Watchdog
