HOT TOPICS LIST
- MACD
- Fibonacci
- RSI
- Gann
- ADXR
- Stochastics
- Volume
- Triangles
- Futures
- Cycles
- Volatility
- ZIGZAG
- MESA
- Retracement
- Aroon
INDICATORS LIST
LIST OF TOPICS
PRINT THIS ARTICLE
by Paolo Pezzutti
The stock has initiated a rebound that could move prices toward a big down gap.
Position: N/A
Paolo Pezzutti
Author of the book "Trading the US Markets - A Comprehensive Guide to US Markets for International Traders and Investors" - Harriman House (July 2008)
PRINT THIS ARTICLE
CANDLESTICK CHARTING
Carnival Develops Short-Term Congestion
06/29/06 08:57:18 AMby Paolo Pezzutti
The stock has initiated a rebound that could move prices toward a big down gap.
Position: N/A
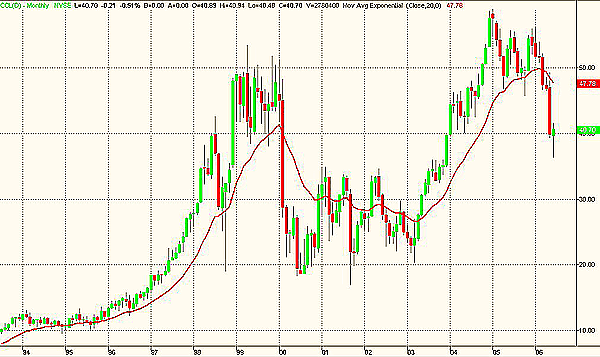
| Recently, Carnival Corp. (CCL) reported second-quarter net earnings down 2.1% from $388 million in the year-ago period, with the explanation that higher fuel prices reduced earnings. The company still expects 2006 net revenue yields to rise 1% to 2%. Therefore, there is not much growth to be expected this year for fundamentals. Let's take a look at the technical conditions of the stock. In Figure 1, you can see that since the beginning of 2005, the stock in the monthly time frame developed a deep correction that brought prices from a high of $59 to the present price of $40.70. The downtrend accelerated last month when prices sank about 20%. The ongoing month has seen Carnival shares form a hammer. This candlestick could indicate the possibility of some type of support at this level. The market spent the past six consecutive months trading down. The bulls had been beaten all along the downtrend. Last month, a shift in the balance between bulls and bears occurred. The market dropped heavily, but bulls stopped the selloff and prices recovered until prices got back very near the open. Psychologically, this is a significant signal. |

|
| FIGURE 1: CCL, MONTHLY. The stock in June has printed a hammer, which could indicate a support level has been reached. |
| Graphic provided by: TradeStation. |
| |
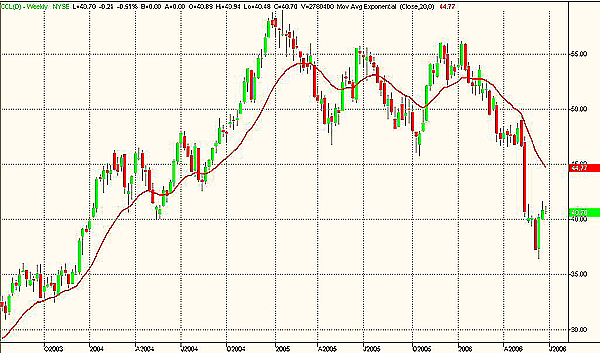
| In Figure 2, the time frame displays that the stock as of two weeks ago printed a bullish engulfing pattern. This pattern prints the switch of traders' attitude toward the market as the bullish forces take control of the bears, ending the second session on a strong, positive close. This pattern indicates that in the next few weeks, we might expect at least a rebound after the steep selloff of the past months. |

|
| FIGURE 2: CCL, WEEKLY. Shares of this stock have printed a bullish engulfing candlestick pattern. During the next weeks, prices could retrace the recent sharp selloff at least partially. |
| Graphic provided by: TradeStation. |
| |
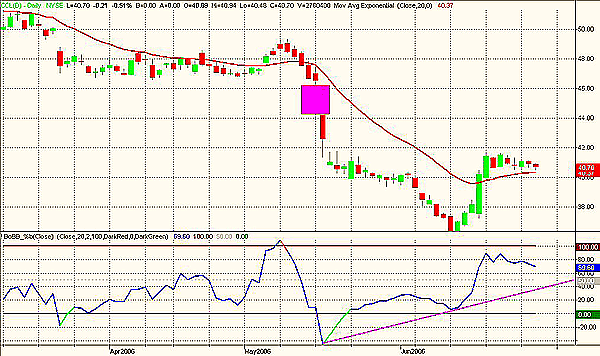
| In Figure 3, you can see how the big gap printed on May 16 caused an acceleration of prices toward new lows. A relative low was finally established on June 12. The Bollinger %b (close) indicator printed a very significant positive divergence in coincidence with this low. This indicator can be used to tell us where we are within the Bollinger Bands. Unlike typical oscillators, which are bounded by zero and 100, %b can assume negative values and values above 100 when prices are outside of the bands. At 100, we are at the upper band, while at zero, we are at the lower band. Above 100, we are above the upper bands and below zero, we are below the lower band. It is a real relative tool, with no absolute information. From that low, prices have now recovered about 10%. After a quick recovery, the stock has entered an eight-session congestion that is still ongoing. Every time prices open or close on four consecutive bars within the range of a "measuring bar," you have congestion. The relative position of highs and lows is not important. A measuring bar is such that when its range contains the open or close of at least the next three bars. In this case, the measuring bar was printed on June 19. Congestions usually last 11–20 price bars. It is very difficult to anticipate the direction of a breakout, but in this case you might expect to see prices move to the upside toward the gap area around $44. |

|
| FIGURE 3: CCL, DAILY. In this time frame, a significant positive divergence of the Bollinger %b (close) indicator was developed with the relative low. |
| Graphic provided by: TradeStation. |
| |
| The stock is in a downtrend in the intermediate time frame. However, in the short term, it is likely to see a continuation of the rebound. If you want to take this trade, you have to be aware that you are trading against the prevailing longer-term trend. Risk is higher in these situations and must be controlled strictly. |
Author of the book "Trading the US Markets - A Comprehensive Guide to US Markets for International Traders and Investors" - Harriman House (July 2008)
| Address: | VIA ROBERTO AGO 26 POSTAL CODE 00166 |
| Rome, ITALY | |
| Phone # for sales: | +393357540708 |
| E-mail address: | pezzutti.paolo@tiscali.it |
Click here for more information about our publications!
Comments
Date: 06/29/06Rank: 3Comment:

Request Information From Our Sponsors
- StockCharts.com, Inc.
- Candle Patterns
- Candlestick Charting Explained
- Intermarket Technical Analysis
- John Murphy on Chart Analysis
- John Murphy's Chart Pattern Recognition
- John Murphy's Market Message
- MurphyExplainsMarketAnalysis-Intermarket Analysis
- MurphyExplainsMarketAnalysis-Visual Analysis
- StockCharts.com
- Technical Analysis of the Financial Markets
- The Visual Investor
- VectorVest, Inc.
- Executive Premier Workshop
- One-Day Options Course
- OptionsPro
- Retirement Income Workshop
- Sure-Fire Trading Systems (VectorVest, Inc.)
- Trading as a Business Workshop
- VectorVest 7 EOD
- VectorVest 7 RealTime/IntraDay
- VectorVest AutoTester
- VectorVest Educational Services
- VectorVest OnLine
- VectorVest Options Analyzer
- VectorVest ProGraphics v6.0
- VectorVest ProTrader 7
- VectorVest RealTime Derby Tool
- VectorVest Simulator
- VectorVest Variator
- VectorVest Watchdog
