HOT TOPICS LIST
- MACD
- Fibonacci
- RSI
- Gann
- ADXR
- Stochastics
- Volume
- Triangles
- Futures
- Cycles
- Volatility
- ZIGZAG
- MESA
- Retracement
- Aroon
INDICATORS LIST
LIST OF TOPICS
PRINT THIS ARTICLE
by David Penn
Rising long-term interest rates in the face of an aggressive Federal Reserve, falling gold, and a rising dollar raise suspicions among some observers.
Position: N/A
David Penn
Technical Writer for Technical Analysis of STOCKS & COMMODITIES magazine, Working-Money.com, and Traders.com Advantage.
PRINT THIS ARTICLE
BOND & INTEREST RATE
Unwinding Bonds
06/29/06 10:09:28 AMby David Penn
Rising long-term interest rates in the face of an aggressive Federal Reserve, falling gold, and a rising dollar raise suspicions among some observers.
Position: N/A
| I was listening toJim Puplava, host of Financial Sense Online, and his guest, analyst Frank Barbera, discuss the 10-year Treasury note. Their conversation is worth listening to in its entirety. But what caught my ear was Barbera's inability to square the circle of a stock, dollar, and gold market that appeared to have bought into the Federal Reserve's aggressive rate-raising policy with the reality of a bond market that continues to weaken. The argument is that a Fed-induced slowdown should weaken the stock market, strengthen the dollar, limit gold's upward progress, and bring long-term interest rates down (creating the sort of inverted yield curve that Fed-induced slowdowns are known for). |

|
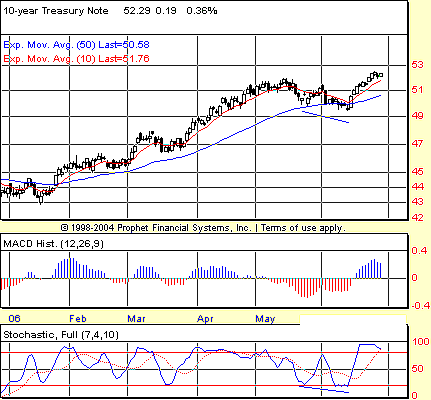
| FIGURE 1: 10-YEAR TREASURY NOTE YIELD, DAILY. Rates on the 10-year Treasury note put in a bottom in mid-June and moved on to make new highs before the end of the month. Note that this bounce was not accompanied by a positive or bullish divergence in the stochastic—although there was one present in the MACD histogram. |
| Graphic provided by: Prophet Financial, Inc. |
| |
| Barbera hinted at the idea that the strange midsummer bond rally is the result of a hedge fund might be unwinding a position in 10-year Treasury notes (Figure 1). Puplava added the possibility of derivative-related positions. I don't know if either is correct (and they themselves admitted to no special knowledge). But the bounding higher of long-term interest rates in the face of a Federal Reserve Board determined to win "street cred" as inflation-fighters is a bit of a mystery. And mysterious movements in the markets often--though not nearly always--have the shenanigans of wrong-side traders at their root (for example, Yasuo Hamanaka, Sumitomo Corp., and the copper crisis of 1995). |
| Is this moment in 10-year T-notes such an instance? Unfortunately, until the bough breaks, there will be no hedge fund babies falling from the sky. Until then, technical traders will likely have the upper hand over those guided by fundamentals--especially as those fundamentals, as they apply to the bond market, are turned at least temporarily on their heads. |

|
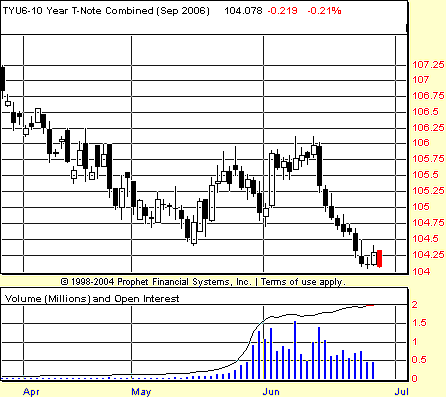
| FIGURE 2: SEPTEMBER 10-YEAR TREASURY NOTE, DAILY. The 10-year T-note was actually trading along with the greenback through May and early June. But what was a breakout in the second half of June for the US Dollar Index was a breakdown in the second half of June for the 10-year Treasury. |
| Graphic provided by: Prophet Financial, Inc. |
| |
| Part of the "unnaturalness" of the rally in long-term yields is related to the fact that, from a cyclic perspective, long bonds should be approaching a peak in yields (or a low in price). Currently, there is a divergence between the price on the 30-year bond, which made its lowest weekly low in early May, and the price on the 10-year note, which made its lowest weekly low more than a month later. It is also interesting to note that the chart of the September T-note looks similar to the chart of the September greenback (Figure 2). Both made lows in mid-May, then successfully tested those lows in early June before rallying to take out their May highs by mid-June. From there, the two diverge significantly. While the dollar pressed on with two big-volume accumulation days in the second half of June, T-notes collapsed, commemorating those same two accumulation days in the dollar with new contract lows for itself. |
| According to the Commitment of Traders report for June 20, commercials and large speculators are net long the 10-year, with "non-reportable positions" (that is, small traders) being significantly short. With regard to the 30-year the bets are more diverse with commercials still largely long, while large speculators and "non-reportable positions" largely short. Conventional wisdom with regard to the Commitment of Traders report suggests that commercial positions are best ignored, "non-reportable positions" best avoided, and large speculator positions best followed. If this proves to be accurate in this instance, then it appears that the divergence exists between large speculators betting on the 10-year and "non-reportable positions" betting against it. This, again, is based on the June 20th report more than a week ago, and in that week the "non-reportable positions" have had a tremendous ride to the downside. But at what point will the "Goliaths" of the market, the large speculators defending the 10-year, decide that enough is enough? |
Technical Writer for Technical Analysis of STOCKS & COMMODITIES magazine, Working-Money.com, and Traders.com Advantage.
| Title: | Technical Writer |
| Company: | Technical Analysis, Inc. |
| Address: | 4757 California Avenue SW |
| Seattle, WA 98116 | |
| Phone # for sales: | 206 938 0570 |
| Fax: | 206 938 1307 |
| Website: | www.Traders.com |
| E-mail address: | DPenn@traders.com |
Traders' Resource Links | |
| Charting the Stock Market: The Wyckoff Method -- Books | |
| Working-Money.com -- Online Trading Services | |
| Traders.com Advantage -- Online Trading Services | |
| Technical Analysis of Stocks & Commodities -- Publications and Newsletters | |
| Working Money, at Working-Money.com -- Publications and Newsletters | |
| Traders.com Advantage -- Publications and Newsletters | |
| Professional Traders Starter Kit -- Software | |
Click here for more information about our publications!
Comments
Date: 06/29/06Rank: 3Comment:

Request Information From Our Sponsors
- StockCharts.com, Inc.
- Candle Patterns
- Candlestick Charting Explained
- Intermarket Technical Analysis
- John Murphy on Chart Analysis
- John Murphy's Chart Pattern Recognition
- John Murphy's Market Message
- MurphyExplainsMarketAnalysis-Intermarket Analysis
- MurphyExplainsMarketAnalysis-Visual Analysis
- StockCharts.com
- Technical Analysis of the Financial Markets
- The Visual Investor
- VectorVest, Inc.
- Executive Premier Workshop
- One-Day Options Course
- OptionsPro
- Retirement Income Workshop
- Sure-Fire Trading Systems (VectorVest, Inc.)
- Trading as a Business Workshop
- VectorVest 7 EOD
- VectorVest 7 RealTime/IntraDay
- VectorVest AutoTester
- VectorVest Educational Services
- VectorVest OnLine
- VectorVest Options Analyzer
- VectorVest ProGraphics v6.0
- VectorVest ProTrader 7
- VectorVest RealTime Derby Tool
- VectorVest Simulator
- VectorVest Variator
- VectorVest Watchdog
