HOT TOPICS LIST
- MACD
- Fibonacci
- RSI
- Gann
- ADXR
- Stochastics
- Volume
- Triangles
- Futures
- Cycles
- Volatility
- ZIGZAG
- MESA
- Retracement
- Aroon
INDICATORS LIST
LIST OF TOPICS
PRINT THIS ARTICLE
by Koos van der Merwe
All charts of the DJIA, S&P, and NASDAQ point to a market selloff in the months and years ahead, but is the chart of the Toronto Stock Exchange suggesting otherwise for the Canadian market?
Position: Sell
Koos van der Merwe
Has been a technical analyst since 1969, and has worked as a futures and options trader with First Financial Futures in Johannesburg, South Africa.
PRINT THIS ARTICLE
GANN
Does The Future Lie In Canada?
06/29/06 10:54:05 AMby Koos van der Merwe
All charts of the DJIA, S&P, and NASDAQ point to a market selloff in the months and years ahead, but is the chart of the Toronto Stock Exchange suggesting otherwise for the Canadian market?
Position: Sell
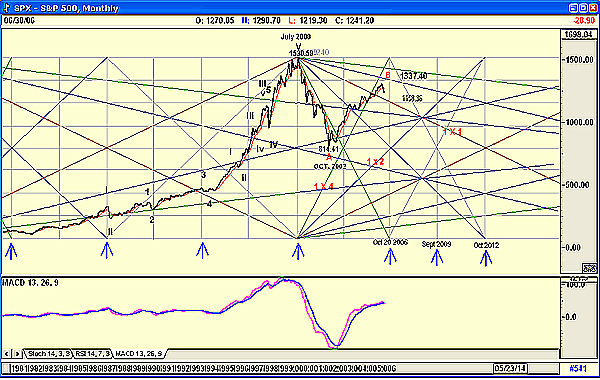
| Figure 1 is the familiar one of the Standard & Poor's 500 suggesting that the index is in the process of completing a B wave and could start a meltdown into a C wave at any time in the coming months, one that charts are suggesting could last till 2012. This would be the end of the first term of the next President of the United States. |

|
| FIGURE 1: SPX, MONTHLY. Here's the familiar chart of the Standard & Poor's 500. |
| Graphic provided by: AdvancedGET. |
| |
| Figure 1 is my preferred Elliott wave count and suggests a completion of wave C in October 2012. What are the chances of this meltdown happening? Very real. In an interview with CNBC's Maria Bartiromo, financier George Soros stated that he believes that a global market meltdown was inevitable. "What is unpredictable," he said, "is how far it will go." |

|
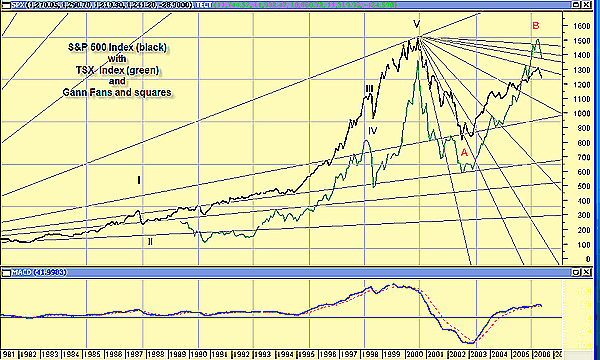
| FIGURE 2: SPX, TORONTO 300. Here's a chart of the S&P 500 with the Toronto 300 superimposed. |
| Graphic provided by: MetaStock. |
| |
| Figure 2 is a MetaStock chart showing a similar SPX chart as Figure 1, but with the Toronto Stock Exchange superimposed in green. Note how the B wave of the TSX is above the V wave. It is seldom that B waves exceed V wave tops, and when they do, it suggests that the C wave fall is not that deep. |

|
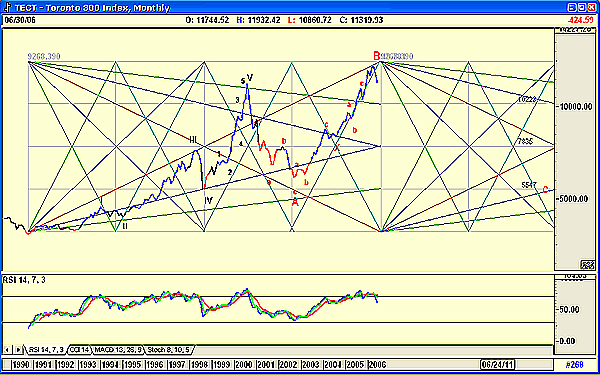
| FIGURE 3: TECT. Here's the Toronto 300 shown with Gann fans. |
| Graphic provided by: AdvancedGET. |
| |
| Figure 3 is the TSX on its own with Gann fans and Gann boxes. In it, I have shown possible targets for the completion of wave C, the most anticipated being between 5547 and 7835. Although this does not look like much, from present levels it would be a fall of 50% were it to fall to the 5547 level, and a 30.7% retracement should it fall to the 7835 level. What this suggests is that the meltdown in the SPX could be far greater... not a pleasant prospect. My guess/estimates are between 39% and 68%. With a weakening of the US dollar, and the possibility of a major collapse in the US market, could you then protect yourself by hedging in Canada? The answer is no. The Canadian stock market may not fall as far as the US market should a meltdown occur, as is anticipated by the fundamentalists, financiers, and the technical analysts, for once in agreement, but the fall will still be a decisive one. Where to go? The answer, of course, is to wait for the present summer rally to end, and then cash is king--at least for the moment. |
Has been a technical analyst since 1969, and has worked as a futures and options trader with First Financial Futures in Johannesburg, South Africa.
| Address: | 3256 West 24th Ave |
| Vancouver, BC | |
| Phone # for sales: | 6042634214 |
| E-mail address: | petroosp@gmail.com |
Click here for more information about our publications!
Comments
Date: 06/29/06Rank: 5Comment:
Date: 06/29/06Rank: 3Comment:
Date: 07/11/06Rank: 4Comment:

Request Information From Our Sponsors
- StockCharts.com, Inc.
- Candle Patterns
- Candlestick Charting Explained
- Intermarket Technical Analysis
- John Murphy on Chart Analysis
- John Murphy's Chart Pattern Recognition
- John Murphy's Market Message
- MurphyExplainsMarketAnalysis-Intermarket Analysis
- MurphyExplainsMarketAnalysis-Visual Analysis
- StockCharts.com
- Technical Analysis of the Financial Markets
- The Visual Investor
- VectorVest, Inc.
- Executive Premier Workshop
- One-Day Options Course
- OptionsPro
- Retirement Income Workshop
- Sure-Fire Trading Systems (VectorVest, Inc.)
- Trading as a Business Workshop
- VectorVest 7 EOD
- VectorVest 7 RealTime/IntraDay
- VectorVest AutoTester
- VectorVest Educational Services
- VectorVest OnLine
- VectorVest Options Analyzer
- VectorVest ProGraphics v6.0
- VectorVest ProTrader 7
- VectorVest RealTime Derby Tool
- VectorVest Simulator
- VectorVest Variator
- VectorVest Watchdog
