HOT TOPICS LIST
- MACD
- Fibonacci
- RSI
- Gann
- ADXR
- Stochastics
- Volume
- Triangles
- Futures
- Cycles
- Volatility
- ZIGZAG
- MESA
- Retracement
- Aroon
INDICATORS LIST
LIST OF TOPICS
PRINT THIS ARTICLE
by David Penn
An hourly symmetrical triangle in the S&P 500 suggests opportunity in volatility.
Position: N/A
David Penn
Technical Writer for Technical Analysis of STOCKS & COMMODITIES magazine, Working-Money.com, and Traders.com Advantage.
PRINT THIS ARTICLE
SYMMETRICAL TRIANGLE
Launching Pads
06/28/06 11:03:38 AMby David Penn
An hourly symmetrical triangle in the S&P 500 suggests opportunity in volatility.
Position: N/A
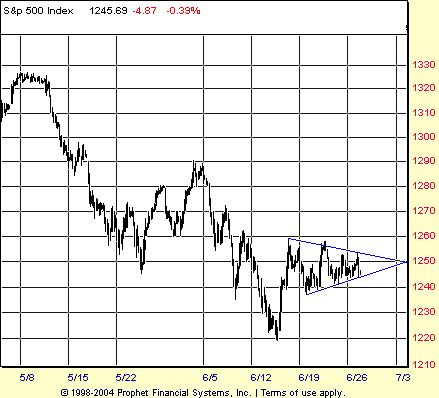
| While much of the world is focused on the launching pads of North Korea and its Taepodong-2 missile, traders and technical analysts may do better to consider the potential launching pad developing in the hourly chart of the Standard & Poor's 500 (Figure 1). |

|
| FIGURE 1: S&P 500, HOURLY. After a virtually vertical bounce in mid-month, the S&P 500 consolidates in a symmetrical triangle with multiple points of contact along both the upper and lower boundaries. |
| Graphic provided by: Prophet Financial, Inc. |
| |
| The triangle makes its initial, highest high late in the session on June 15. From that point to the present, the S&P 500 on the hourly chart is fairly well-contained between two converging trendlines. This pattern suggests that a triangle consolidation is (or has been) building in the S&P 500. |
| If this pattern is a triangle, then the break should come soon. As Thomas Bulkowski notes in his Encyclopedia Of Chart Patterns, most successful breakouts from symmetrical triangles tend to occur two-thirds to three-quarters of the way to the triangle apex (where the converging trendlines eventually intersect). The triangle from initial high to apex is approximately 12 days long. That suggests that the best chance for a successful breakout is eight to nine days in. That would be Tuesday, June 27 ("Turnaround Tuesday"?), and Wednesday, June 28. |

|
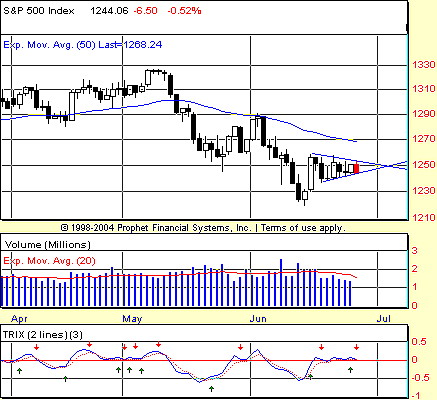
| FIGURE 2: S&P 500, DAILY. A series of buy and sell signals late in the development of the symmetrical triangle further suggest the potential for a sizable move once the boundaries of the converging trendlines are broken. |
| Graphic provided by: Prophet Financial, Inc. |
| |
| What is the likely upside ... and downside to this triangle? Roughly 20 points wide at its widest point, adding 20 to the highest high in the formation (again, per Bulkowski's Encyclopedia) provides for an upside near 1280. Subtracting that same 20 points from the value at the lowest low in the formation suggests a break to 1220. |
| Because the bounce in the second half of June never rallied above the lows of May (on a closing basis, the low close in May was higher than the high close—so far—in June), the downside is likely where the focus is. A breakdown would also set up the potential for a test of the year-to-date lows in the S&P, set only a few weeks ago (Figure 2). Those lows at 1220 also represent the lower boundary of the trend channel that extends from the lows of 2004, and a potentially significant source of support (see my "Channeling Bottoms," Traders.com Advantage, June 20, 2006). |
Technical Writer for Technical Analysis of STOCKS & COMMODITIES magazine, Working-Money.com, and Traders.com Advantage.
| Title: | Technical Writer |
| Company: | Technical Analysis, Inc. |
| Address: | 4757 California Avenue SW |
| Seattle, WA 98116 | |
| Phone # for sales: | 206 938 0570 |
| Fax: | 206 938 1307 |
| Website: | www.Traders.com |
| E-mail address: | DPenn@traders.com |
Traders' Resource Links | |
| Charting the Stock Market: The Wyckoff Method -- Books | |
| Working-Money.com -- Online Trading Services | |
| Traders.com Advantage -- Online Trading Services | |
| Technical Analysis of Stocks & Commodities -- Publications and Newsletters | |
| Working Money, at Working-Money.com -- Publications and Newsletters | |
| Traders.com Advantage -- Publications and Newsletters | |
| Professional Traders Starter Kit -- Software | |
Click here for more information about our publications!
Comments
Date: 06/28/06Rank: 4Comment:
Date: 06/29/06Rank: 5Comment:

|

Request Information From Our Sponsors
- StockCharts.com, Inc.
- Candle Patterns
- Candlestick Charting Explained
- Intermarket Technical Analysis
- John Murphy on Chart Analysis
- John Murphy's Chart Pattern Recognition
- John Murphy's Market Message
- MurphyExplainsMarketAnalysis-Intermarket Analysis
- MurphyExplainsMarketAnalysis-Visual Analysis
- StockCharts.com
- Technical Analysis of the Financial Markets
- The Visual Investor
- VectorVest, Inc.
- Executive Premier Workshop
- One-Day Options Course
- OptionsPro
- Retirement Income Workshop
- Sure-Fire Trading Systems (VectorVest, Inc.)
- Trading as a Business Workshop
- VectorVest 7 EOD
- VectorVest 7 RealTime/IntraDay
- VectorVest AutoTester
- VectorVest Educational Services
- VectorVest OnLine
- VectorVest Options Analyzer
- VectorVest ProGraphics v6.0
- VectorVest ProTrader 7
- VectorVest RealTime Derby Tool
- VectorVest Simulator
- VectorVest Variator
- VectorVest Watchdog
