HOT TOPICS LIST
- MACD
- Fibonacci
- RSI
- Gann
- ADXR
- Stochastics
- Volume
- Triangles
- Futures
- Cycles
- Volatility
- ZIGZAG
- MESA
- Retracement
- Aroon
INDICATORS LIST
LIST OF TOPICS
PRINT THIS ARTICLE
by Arthur Hill
Gap Inc. looked like it was basing a few months ago, but a recent support break signals a continuation of the long-term downtrend.
Position: Sell
Arthur Hill
Arthur Hill is currently editor of TDTrader.com, a website specializing in trading strategies, sector/industry specific breadth stats and overall technical analysis. He passed the Society of Technical Analysts (STA London) diploma exam with distinction is a Certified Financial Technician (CFTe). Prior to TD Trader, he was the Chief Technical Analyst for Stockcharts.com and the main contributor to the ChartSchool.
PRINT THIS ARTICLE
TRIANGLES
Gap Continues Lower
06/28/06 10:52:16 AMby Arthur Hill
Gap Inc. looked like it was basing a few months ago, but a recent support break signals a continuation of the long-term downtrend.
Position: Sell
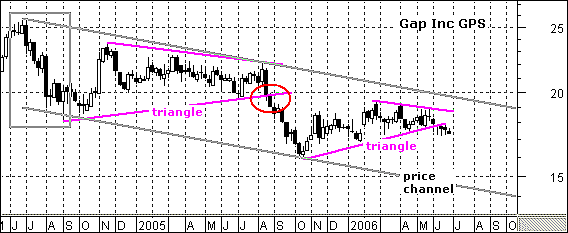
| Let's start with the weekly chart for some perspective (Figure 1). The stock declined sharply in July–August 2004 (gray box) and then formed a big triangle consolidation. It was two to three months down and then 11-12 months flat in the triangle. The stock continued lower with a support break in August 2005 (red oval) and bottomed in October. It was another two- to three-month decline and then an eight- to nine-month consolidation unfolded (second triangle). |

|
| FIGURE 1: GAP, WEEKLY. This stock dropped in the July–August period (gray box) and then formed a triangle consolidation. |
| Graphic provided by: MetaStock. |
| |
| It now looks as if this consolidation has ended, as GPS signaled a continuation lower with a move below the lower triangle trendline and April low. The downside target is around 14 over the last two to three months. I found this target by drawing a falling price channel and extending the lower trendline into September. |
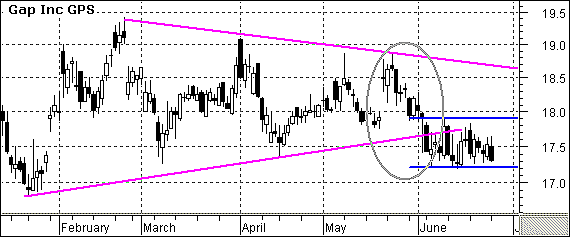
| There are bearish developments on the daily chart, too (Figure 2). Gap Inc. broke the lower triangle trendline with a sharp decline below 17.5 (gray oval). A flat flag then formed, and this is a continuation pattern (blue lines). A move below the flag low (17.2) would signal a continuation lower and target a move to around 16.5. |

|
| FIGURE 2: GAP, DAILY. The bearish consolidation could also be seen in the daily chart. |
| Graphic provided by: MetaStock. |
| |
| The flag also established resistance just below 18 and this gives the bears a point to be wrong. Failure to move lower and a break above 18 would show resilience and negate this bearish prognosis. |
Arthur Hill is currently editor of TDTrader.com, a website specializing in trading strategies, sector/industry specific breadth stats and overall technical analysis. He passed the Society of Technical Analysts (STA London) diploma exam with distinction is a Certified Financial Technician (CFTe). Prior to TD Trader, he was the Chief Technical Analyst for Stockcharts.com and the main contributor to the ChartSchool.
| Title: | Editor |
| Company: | TDTrader.com |
| Address: | Willem Geetsstraat 17 |
| Mechelen, B2800 | |
| Phone # for sales: | 3215345465 |
| Website: | www.tdtrader.com |
| E-mail address: | arthurh@tdtrader.com |
Traders' Resource Links | |
| TDTrader.com has not added any product or service information to TRADERS' RESOURCE. | |
Click here for more information about our publications!
Comments
Date: 06/28/06Rank: 4Comment:

|

Request Information From Our Sponsors
- StockCharts.com, Inc.
- Candle Patterns
- Candlestick Charting Explained
- Intermarket Technical Analysis
- John Murphy on Chart Analysis
- John Murphy's Chart Pattern Recognition
- John Murphy's Market Message
- MurphyExplainsMarketAnalysis-Intermarket Analysis
- MurphyExplainsMarketAnalysis-Visual Analysis
- StockCharts.com
- Technical Analysis of the Financial Markets
- The Visual Investor
- VectorVest, Inc.
- Executive Premier Workshop
- One-Day Options Course
- OptionsPro
- Retirement Income Workshop
- Sure-Fire Trading Systems (VectorVest, Inc.)
- Trading as a Business Workshop
- VectorVest 7 EOD
- VectorVest 7 RealTime/IntraDay
- VectorVest AutoTester
- VectorVest Educational Services
- VectorVest OnLine
- VectorVest Options Analyzer
- VectorVest ProGraphics v6.0
- VectorVest ProTrader 7
- VectorVest RealTime Derby Tool
- VectorVest Simulator
- VectorVest Variator
- VectorVest Watchdog
