HOT TOPICS LIST
- MACD
- Fibonacci
- RSI
- Gann
- ADXR
- Stochastics
- Volume
- Triangles
- Futures
- Cycles
- Volatility
- ZIGZAG
- MESA
- Retracement
- Aroon
INDICATORS LIST
LIST OF TOPICS
PRINT THIS ARTICLE
by Gary Grosschadl
This stock has seen a dramatic rise and fall. Is there a bounce in the offing?
Position: Hold
Gary Grosschadl
Independent Canadian equities trader and technical analyst based in Peterborough
Ontario, Canada.
PRINT THIS ARTICLE
FIBONACCI
Broadcom Peaked, Now Trying To Bounce
06/28/06 10:42:17 AMby Gary Grosschadl
This stock has seen a dramatic rise and fall. Is there a bounce in the offing?
Position: Hold
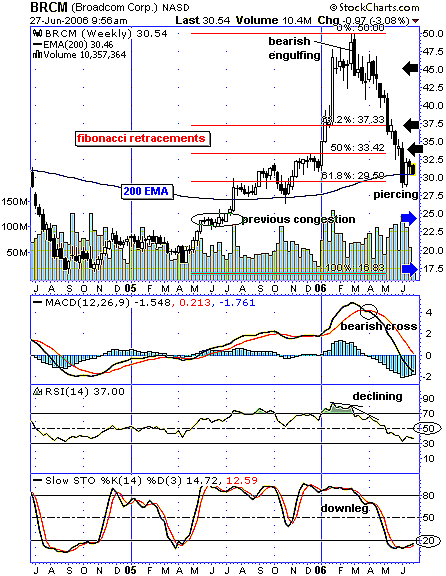
| Broadcom is a leading supplier of integrated circuits for broadband communications, outsourcing all semiconductor manufacturing to Asian merchant foundries. The weekly chart shown in Figure 1 shows a dramatic rise and fall, and traders may be looking for a bounce. Note the candlestick formation as the stock peaked at what was probably a psychological resistance level of $50. This bearish engulfing formation is often a reliable reversal pattern after a strong upleg. Traders who heeded that signal did well to avoid the ensuing downtrend. |
| Fibonacci retracement levels are plotted on this chart, taking into account the high and low. The most common retracements are shown that roughly relate to declines of 1/3, 1/2 and 2/3. The stock recently touched the 61.8% retracement level, and this can be a strong support level. |

|
| FIGURE 1: BROADCOM, WEEKLY. This chart for Broadcom shows important support level. |
| Graphic provided by: StockCharts.com. |
| |
| Adding emphasis to this level is the location of the ever-important 200-period exponential moving average (EMA) currently 30.46. Two possible support levels and a bullish candle pattern hint at bounce potential here. A "piercing line" is a bullish two-day reversal pattern. The first day, in a downtrend, is a long black day. The next day opens at a new low, then closes above the midpoint of the body of the first day. However, this pattern still needs to confirm higher. Currently, it appears to be stalled. |
| The indicators below the chart showed their warning signs after the stock peaked at $50. For a bullish sign to occur now, the moving average convergence/divergence (MACD) indicator needs a bullish cross. As this is a somewhat lagging indicator, look for the stochastics oscillator to first rise above its oversold 20 level. With a bullish reversal, the relative strength index (RSI) will also give its eventual nod with a move above its key 50 level. |
| Should a bounce occur, the black arrows show upside targets—a weak bounce to previous brief support near $33, a stronger bounce to the next similar support near 37.50, or a big move to $45 representing the congestion area near the previous peak. Should support fail at current levels near $30, then downside targets are suggested at previous congestion just below $25 and ultimately $17.50, near multiyear lows. A close below the current 200-day EMA suggests failure of the possible bounce. |
Independent Canadian equities trader and technical analyst based in Peterborough
Ontario, Canada.
| Website: | www.whatsonsale.ca/financial.html |
| E-mail address: | gwg7@sympatico.ca |
Click here for more information about our publications!
Comments
Date: 06/28/06Rank: 5Comment:
Date: 07/02/06Rank: 5Comment: Thank u for the timely alert on the is there a Bounce in the offing
Email : raghuprasad2304@yahoo.com.sg

Request Information From Our Sponsors
- VectorVest, Inc.
- Executive Premier Workshop
- One-Day Options Course
- OptionsPro
- Retirement Income Workshop
- Sure-Fire Trading Systems (VectorVest, Inc.)
- Trading as a Business Workshop
- VectorVest 7 EOD
- VectorVest 7 RealTime/IntraDay
- VectorVest AutoTester
- VectorVest Educational Services
- VectorVest OnLine
- VectorVest Options Analyzer
- VectorVest ProGraphics v6.0
- VectorVest ProTrader 7
- VectorVest RealTime Derby Tool
- VectorVest Simulator
- VectorVest Variator
- VectorVest Watchdog
- StockCharts.com, Inc.
- Candle Patterns
- Candlestick Charting Explained
- Intermarket Technical Analysis
- John Murphy on Chart Analysis
- John Murphy's Chart Pattern Recognition
- John Murphy's Market Message
- MurphyExplainsMarketAnalysis-Intermarket Analysis
- MurphyExplainsMarketAnalysis-Visual Analysis
- StockCharts.com
- Technical Analysis of the Financial Markets
- The Visual Investor
