HOT TOPICS LIST
- MACD
- Fibonacci
- RSI
- Gann
- ADXR
- Stochastics
- Volume
- Triangles
- Futures
- Cycles
- Volatility
- ZIGZAG
- MESA
- Retracement
- Aroon
INDICATORS LIST
LIST OF TOPICS
PRINT THIS ARTICLE
by Arthur Hill
While the broader market remains weak, COCO shows signs of buying pressure and good relative strength that could foreshadow a breakout.
Position: Accumulate
Arthur Hill
Arthur Hill is currently editor of TDTrader.com, a website specializing in trading strategies, sector/industry specific breadth stats and overall technical analysis. He passed the Society of Technical Analysts (STA London) diploma exam with distinction is a Certified Financial Technician (CFTe). Prior to TD Trader, he was the Chief Technical Analyst for Stockcharts.com and the main contributor to the ChartSchool.
PRINT THIS ARTICLE
REL. STR COMPARATIVE
Coco Gets Some Relative Gogo
06/28/06 10:21:22 AMby Arthur Hill
While the broader market remains weak, COCO shows signs of buying pressure and good relative strength that could foreshadow a breakout.
Position: Accumulate
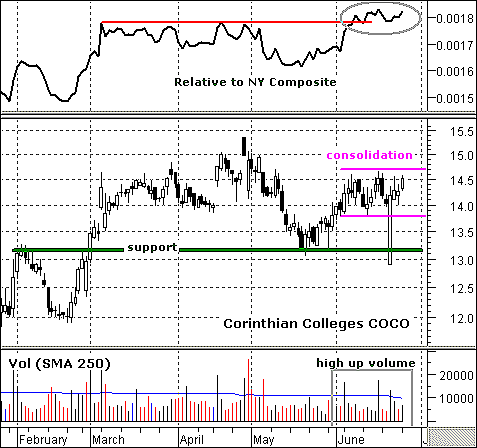
| Figure 1 shows the price relative and compares the performance of Corinthian Colleges (COCO) relative to the NYSE Composite. It is a relative strength index (RSI) that tells me if COCO is outperforming (in favor) or underperforming (out of favor). The price relative broke resistance in June, and this tells me that COCO is outperforming the broader market. This is a bullish sign. |

|
| FIGURE 1: CORINTHIAN COLLEGES. The price relative broke resistance in June, indicating that COCO was outperforming the broader market, a bullish sign. |
| Graphic provided by: MetaStock. |
| Graphic provided by: MS QuoteCenter. |
| |
| Despite this relative strength, COCO has been range-bound since early March. The stock first crossed above 14 on March 6. Despite a big surge in April and May, the stock has been trading around 14 for the month of June. There was a big gap below 13 with a weak open on June 21, but the stock rebounded and closed in the trading range (13.7 to 14.3). I am willing to ignore this opening spike and keep my focus on the current consolidation (magenta lines). A break above 14.3 would be bullish and a break below 13.7 would be bearish. |
| Volume patterns point to an upside breakout. In addition to the good relative strength noted in the first paragraph, upside volume has been outpacing downside volume. There were three big volume days in June, and all three were up days. The stock closed lower seven times this month (so far), and each move lower occurred on below average volume. This combination of weak selling pressure and strong buying pressure increases the odds of an upside breakout. |
Arthur Hill is currently editor of TDTrader.com, a website specializing in trading strategies, sector/industry specific breadth stats and overall technical analysis. He passed the Society of Technical Analysts (STA London) diploma exam with distinction is a Certified Financial Technician (CFTe). Prior to TD Trader, he was the Chief Technical Analyst for Stockcharts.com and the main contributor to the ChartSchool.
| Title: | Editor |
| Company: | TDTrader.com |
| Address: | Willem Geetsstraat 17 |
| Mechelen, B2800 | |
| Phone # for sales: | 3215345465 |
| Website: | www.tdtrader.com |
| E-mail address: | arthurh@tdtrader.com |
Traders' Resource Links | |
| TDTrader.com has not added any product or service information to TRADERS' RESOURCE. | |
Click here for more information about our publications!
Comments
Date: 06/28/06Rank: 4Comment:

Request Information From Our Sponsors
- StockCharts.com, Inc.
- Candle Patterns
- Candlestick Charting Explained
- Intermarket Technical Analysis
- John Murphy on Chart Analysis
- John Murphy's Chart Pattern Recognition
- John Murphy's Market Message
- MurphyExplainsMarketAnalysis-Intermarket Analysis
- MurphyExplainsMarketAnalysis-Visual Analysis
- StockCharts.com
- Technical Analysis of the Financial Markets
- The Visual Investor
- VectorVest, Inc.
- Executive Premier Workshop
- One-Day Options Course
- OptionsPro
- Retirement Income Workshop
- Sure-Fire Trading Systems (VectorVest, Inc.)
- Trading as a Business Workshop
- VectorVest 7 EOD
- VectorVest 7 RealTime/IntraDay
- VectorVest AutoTester
- VectorVest Educational Services
- VectorVest OnLine
- VectorVest Options Analyzer
- VectorVest ProGraphics v6.0
- VectorVest ProTrader 7
- VectorVest RealTime Derby Tool
- VectorVest Simulator
- VectorVest Variator
- VectorVest Watchdog
