HOT TOPICS LIST
- MACD
- Fibonacci
- RSI
- Gann
- ADXR
- Stochastics
- Volume
- Triangles
- Futures
- Cycles
- Volatility
- ZIGZAG
- MESA
- Retracement
- Aroon
INDICATORS LIST
LIST OF TOPICS
PRINT THIS ARTICLE
by David Penn
With a window of opportunity for a significant low beginning to open, patience may be a gold bug's best friend.
Position: N/A
David Penn
Technical Writer for Technical Analysis of STOCKS & COMMODITIES magazine, Working-Money.com, and Traders.com Advantage.
PRINT THIS ARTICLE
REVERSAL
Gold Bugs Bide Their Time
06/25/06 01:26:57 PMby David Penn
With a window of opportunity for a significant low beginning to open, patience may be a gold bug's best friend.
Position: N/A
| Based on the cycles analysis of Tim Wood, there is an interesting window of opportunity for gold and gold stocks to make a significant low this summer. Those interested in the specifics of that window of opportunity should check out Wood's work at cyclesman.com. Here and now, however, suffice it to say that the possibility of a tradable summer low is something that should warm the hearts of those investors and speculators in gold who have seen their positions melt away during the May–June 2006 correction. |

|
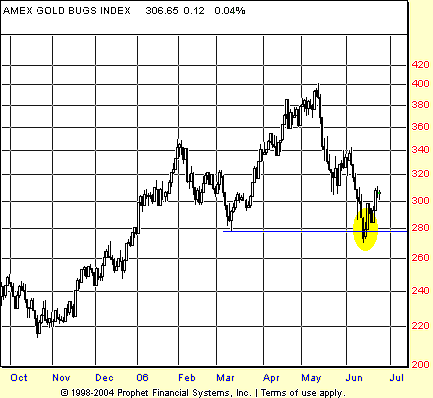
| FIGURE 1: AMEX GOLD BUGS INDEX, DAILY. A bear trap in the form of a 2B bottom stemmed the decline in gold stocks that began in early May. Next up is a test of the June highs just north of 340. |
| Graphic provided by: Prophet Financial, Inc. |
| |
| I like to use analysis like Wood's cycles, Elliott wave theory, Dow theory, sector analysis, and relatively conventional Austrian economics to provide a general context for my technical observations. While I won't make a move that isn't supported by my technical methods, I tend to want something other than technicals alone before making a speculative decision. So given Wood's analysis of the opportunities for gold and gold stocks in the intermediate term, my goal is to look at a chart of something like the AMEX Gold BUGS Index ($HUI) for evidence that supports the broader thesis. |
| As Figure 1 shows, one sign of a potential bounce comes in the form of the 2B test of bottom that took place in mid-June as the $HUI tested the March lows. Those lows, according to Wood, were significant lows, finishing off a correction in the $HUI that took the index from just north of 340 to about 280 from earliest February to early March. Generally speaking, violating lows of those significance in the subsequent correction is a bearish development. As such, speculators should be cautious about the ability of any near-term bounce to set new highs in the $HUI. That said, new highs in the $HUI do not necessarily have to be reached for a significant rally in gold mining shares to take place. Consider that even a 20% rally from current levels in the $HUI would still leave the $HUI more than 30 points away from a new high. While I expect gold stocks to move higher over the next few weeks, traders don't need to believe in new highs in order to take advantage of any upside. |

|
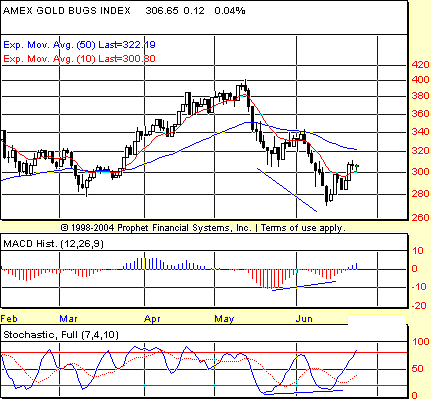
| FIGURE 2: AMEX GOLD BUGS INDEX, DAILY. Positive or bullish divergences in both the MACD histogram and the stochastic suggest that a bottom of some significance has developed in gold stock in mid-June. |
| Graphic provided by: Prophet Financial, Inc. |
| |
| Further evidence of a bottom is available courtesy of the indicators shown in Figure 2. These indicators, the moving average convergence/divergence histogram (MACDH), and the stochastic have developed positive, month-on-month, divergences vis-a-vis the $HUI. While it is possible that a running positive divergence could develop, with the $HUI creating yet another lower low and the indicators continuing to make higher lows, the current context of cycles and widespread fear that the Federal Reserve will induce a recession (a deflationary or at least disinflationary phenomenon that would likely bring gold prices down further) means that speculators should be on guard for the possibility of a continued move higher in the $HUI. |
| Such a move would initially test resistance in the form of the declining 50-day exponential moving average (approximately 320), with the next significant test being the early June highs (approximately 340). After a 10–11% move to the 340 level, things could get very interesting. If the softening economy/recession crowd is right, then there is a likelihood that the $HUI will not make a new high north of 400 and instead reverse and eventually take out the June correction low. This gets a little ahead of the game, but a rally that peaked out in the 340 area would probably create a tempting head & shoulders top pattern with a possible downside of 160 and a test of the lows of last year. |
Technical Writer for Technical Analysis of STOCKS & COMMODITIES magazine, Working-Money.com, and Traders.com Advantage.
| Title: | Technical Writer |
| Company: | Technical Analysis, Inc. |
| Address: | 4757 California Avenue SW |
| Seattle, WA 98116 | |
| Phone # for sales: | 206 938 0570 |
| Fax: | 206 938 1307 |
| Website: | www.Traders.com |
| E-mail address: | DPenn@traders.com |
Traders' Resource Links | |
| Charting the Stock Market: The Wyckoff Method -- Books | |
| Working-Money.com -- Online Trading Services | |
| Traders.com Advantage -- Online Trading Services | |
| Technical Analysis of Stocks & Commodities -- Publications and Newsletters | |
| Working Money, at Working-Money.com -- Publications and Newsletters | |
| Traders.com Advantage -- Publications and Newsletters | |
| Professional Traders Starter Kit -- Software | |
Click here for more information about our publications!
Comments
Date: 06/25/06Rank: 3Comment:
Date: 06/27/06Rank: 5Comment:
Date: 07/04/06Rank: 5Comment:

Request Information From Our Sponsors
- StockCharts.com, Inc.
- Candle Patterns
- Candlestick Charting Explained
- Intermarket Technical Analysis
- John Murphy on Chart Analysis
- John Murphy's Chart Pattern Recognition
- John Murphy's Market Message
- MurphyExplainsMarketAnalysis-Intermarket Analysis
- MurphyExplainsMarketAnalysis-Visual Analysis
- StockCharts.com
- Technical Analysis of the Financial Markets
- The Visual Investor
- VectorVest, Inc.
- Executive Premier Workshop
- One-Day Options Course
- OptionsPro
- Retirement Income Workshop
- Sure-Fire Trading Systems (VectorVest, Inc.)
- Trading as a Business Workshop
- VectorVest 7 EOD
- VectorVest 7 RealTime/IntraDay
- VectorVest AutoTester
- VectorVest Educational Services
- VectorVest OnLine
- VectorVest Options Analyzer
- VectorVest ProGraphics v6.0
- VectorVest ProTrader 7
- VectorVest RealTime Derby Tool
- VectorVest Simulator
- VectorVest Variator
- VectorVest Watchdog
