

HOT TOPICS LIST
- MACD
- Fibonacci
- RSI
- Gann
- ADXR
- Stochastics
- Volume
- Triangles
- Futures
- Cycles
- Volatility
- ZIGZAG
- MESA
- Retracement
- Aroon
INDICATORS LIST
LIST OF TOPICS
PRINT THIS ARTICLE
by Arthur Hill
Conditions are ripe for a bounce as the Philadelphia Semiconductor Index trades near support and becomes oversold.
Position: Hold
Arthur Hill
Arthur Hill is currently editor of TDTrader.com, a website specializing in trading strategies, sector/industry specific breadth stats and overall technical analysis. He passed the Society of Technical Analysts (STA London) diploma exam with distinction is a Certified Financial Technician (CFTe). Prior to TD Trader, he was the Chief Technical Analyst for Stockcharts.com and the main contributor to the ChartSchool.
PRINT THIS ARTICLE
CCI
SOX Is Oversold And At Support
06/20/06 09:17:39 AMby Arthur Hill
Conditions are ripe for a bounce as the Philadelphia Semiconductor Index trades near support and becomes oversold.
Position: Hold
| On the weekly chart (Figure 1), three items come together to mark support between 400 and 450. First, the 200-week moving average extends to 425. This moving average marked resistance twice (December 2004–March 2005) and support twice (July 2005–October 2005). Second, the trendline extending up from the September 2005 lows marks support around 430. Third, there is a support zone from prior resistance (~450) and current support (420). The gray box marks this. Taken together, there is clearly a lot of support around 430. |
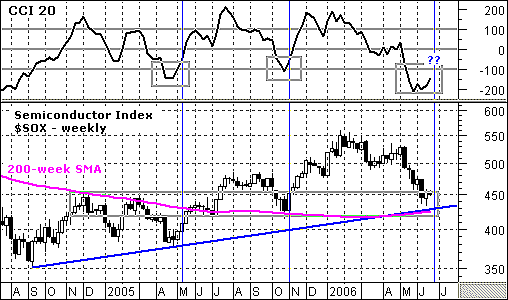
|
| FIGURE 1: $SOX, WEEKLY. The three gray boxes mark support between 400 and 450. |
| Graphic provided by: MetaStock. |
| Graphic provided by: MS QuoteCenter. |
| |
| In addition to support, the commodity channel index (CCI) has become oversold for the third time since the September 2005 advance began. The gray boxes show CCI dipping below -100 and moving back above -100. These dips acted as good buy signals in May 2005 and November 2005. CCI is currently trading below -100 and again oversold. However, it has yet to move back above -100 and trigger a bull signal. Even though the stock is oversold and at support, I am more inclined to wait for a bull signal before betting on a bounce. |
Arthur Hill is currently editor of TDTrader.com, a website specializing in trading strategies, sector/industry specific breadth stats and overall technical analysis. He passed the Society of Technical Analysts (STA London) diploma exam with distinction is a Certified Financial Technician (CFTe). Prior to TD Trader, he was the Chief Technical Analyst for Stockcharts.com and the main contributor to the ChartSchool.
| Title: | Editor |
| Company: | TDTrader.com |
| Address: | Willem Geetsstraat 17 |
| Mechelen, B2800 | |
| Phone # for sales: | 3215345465 |
| Website: | www.tdtrader.com |
| E-mail address: | arthurh@tdtrader.com |
Traders' Resource Links | |
| TDTrader.com has not added any product or service information to TRADERS' RESOURCE. | |
Click here for more information about our publications!
Comments
Date:�06/20/06Rank:�4Comment:�
Date:�06/21/06Rank:�5Comment:�

Request Information From Our Sponsors
- StockCharts.com, Inc.
- Candle Patterns
- Candlestick Charting Explained
- Intermarket Technical Analysis
- John Murphy on Chart Analysis
- John Murphy's Chart Pattern Recognition
- John Murphy's Market Message
- MurphyExplainsMarketAnalysis-Intermarket Analysis
- MurphyExplainsMarketAnalysis-Visual Analysis
- StockCharts.com
- Technical Analysis of the Financial Markets
- The Visual Investor
- VectorVest, Inc.
- Executive Premier Workshop
- One-Day Options Course
- OptionsPro
- Retirement Income Workshop
- Sure-Fire Trading Systems (VectorVest, Inc.)
- Trading as a Business Workshop
- VectorVest 7 EOD
- VectorVest 7 RealTime/IntraDay
- VectorVest AutoTester
- VectorVest Educational Services
- VectorVest OnLine
- VectorVest Options Analyzer
- VectorVest ProGraphics v6.0
- VectorVest ProTrader 7
- VectorVest RealTime Derby Tool
- VectorVest Simulator
- VectorVest Variator
- VectorVest Watchdog