HOT TOPICS LIST
- MACD
- Fibonacci
- RSI
- Gann
- ADXR
- Stochastics
- Volume
- Triangles
- Futures
- Cycles
- Volatility
- ZIGZAG
- MESA
- Retracement
- Aroon
INDICATORS LIST
LIST OF TOPICS
PRINT THIS ARTICLE
by David Penn
The correction in the first half of summer 2006 brings the S&P 500 to a potentially significant source of support.
Position: N/A
David Penn
Technical Writer for Technical Analysis of STOCKS & COMMODITIES magazine, Working-Money.com, and Traders.com Advantage.
PRINT THIS ARTICLE
TREND-CHANNEL
Channeling Bottoms
06/20/06 09:04:21 AMby David Penn
The correction in the first half of summer 2006 brings the S&P 500 to a potentially significant source of support.
Position: N/A
| I was talking late on Friday afternoon with a colleague here at the office. We were marveling at the simplicity of a certain well-known technical trader's trading methodology, a methodology we half-jokingly summed up as "support and resistance." No indicators or systems, no Fibonacci retracements, and certainly no Elliott waves guided this trader's path through bull and bear markets. Instead, he simply found likely sources of support, bought the market, and put a stop beneath support. Alternately, he found places where resistance was likely to be encountered, sold the market in question, and put a stop above the resistance level. Easy as pie, right? |

|
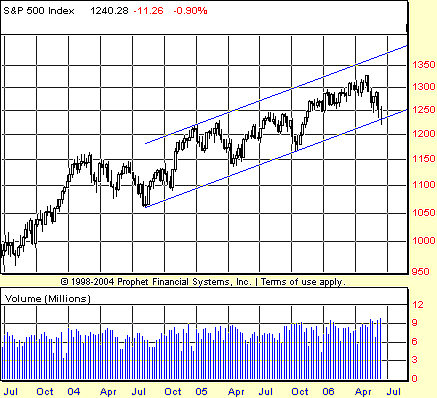
| FIGURE 1: S&P 500, WEEKLY. Falling to the lower boundary of its trend channel late in the second quarter of 2006, the S&P 500 forms a hammer candlestick that suggests that the market might have found support between 1250 and 1225. |
| Graphic provided by: Prophet Financial, Inc. |
| |
| When I sat down to review the charts over the weekend, this three-year weekly chart of the Standard & Poor's 500 stood out (Figure 1)—not apart from other charts I study, such as the chart of the NYSE composite ($NYA), but because it seemed to underscore what I was seeing elsewhere. And what was I seeing? Namely, a market that has moved up toward the top of a multiyear trend channel and was now—successfully, as it appears—testing the lower boundary of that trend channel for support. |
| As I write in an upcoming article for Working-Money.com ("The Case For New Highs"), what helps cinch the deal on a test of the lower boundary is the candlestick pattern that accompanied that test. While there was evidence for weeks that momentum on the downside might be waning, the hammer candlestick that developed during the week of June 12–16 provided a fairly clear signal that the downside beyond the lows of that week was extremely limited. |

|
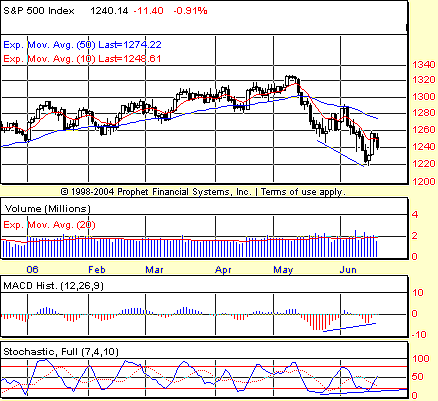
| FIGURE 2: S&P 500, DAILY. Month-on-month positive (bullish) divergences in both the stochastic and the MACD histogram hint at the possibility of an intermediate-term low in late June. |
| Graphic provided by: Prophet Financial, Inc. |
| |
| Figure 2 begins to suggest just how limited the downside might be from here. The May–June decline in the S&P 500 took out a number of previous minor lows en route to setting a new year-to-date low. Yet the bullishness implied by the support of the lower boundary of the trend channel shown in the weekly chart in Figure 1 is virtually matched by the glimmers of bullish opportunity observable in the daily chart in Figure 2. Here, I am referring specifically to the pair of positive, or bullish, divergences in both the stochastic and the moving average convergence/divergence (MACD) histogram. Generally, I prefer the divergence signals provided by the stochastic when using daily charts. However, I will consider the stochastic signals to be that much more significant if they are accompanied by "confirmation" in the form of a similar divergence in the MACD histogram. |
| If these divergences are accurate, then the S&P 500 should not fall any lower than 1220 on a closing basis—at least not before making a significant rally attempt to move higher. In the absence of such a rally—if, for example, the S&P 500 moves sideways—then speculators will need to be prepared for further declines, even if odds still favor higher prices in the near term. If the correction lows of the first half of 2006 are to be a meaningful bottom, then it would not be surprising if the S&P 500 created a multiple or running divergence with three or more relevant lows, instead of the two relevant lows under analysis here. |
Technical Writer for Technical Analysis of STOCKS & COMMODITIES magazine, Working-Money.com, and Traders.com Advantage.
| Title: | Technical Writer |
| Company: | Technical Analysis, Inc. |
| Address: | 4757 California Avenue SW |
| Seattle, WA 98116 | |
| Phone # for sales: | 206 938 0570 |
| Fax: | 206 938 1307 |
| Website: | www.Traders.com |
| E-mail address: | DPenn@traders.com |
Traders' Resource Links | |
| Charting the Stock Market: The Wyckoff Method -- Books | |
| Working-Money.com -- Online Trading Services | |
| Traders.com Advantage -- Online Trading Services | |
| Technical Analysis of Stocks & Commodities -- Publications and Newsletters | |
| Working Money, at Working-Money.com -- Publications and Newsletters | |
| Traders.com Advantage -- Publications and Newsletters | |
| Professional Traders Starter Kit -- Software | |
Click here for more information about our publications!
Comments
Date: 06/20/06Rank: 3Comment:
Date: 06/21/06Rank: 5Comment:

Request Information From Our Sponsors
- StockCharts.com, Inc.
- Candle Patterns
- Candlestick Charting Explained
- Intermarket Technical Analysis
- John Murphy on Chart Analysis
- John Murphy's Chart Pattern Recognition
- John Murphy's Market Message
- MurphyExplainsMarketAnalysis-Intermarket Analysis
- MurphyExplainsMarketAnalysis-Visual Analysis
- StockCharts.com
- Technical Analysis of the Financial Markets
- The Visual Investor
- VectorVest, Inc.
- Executive Premier Workshop
- One-Day Options Course
- OptionsPro
- Retirement Income Workshop
- Sure-Fire Trading Systems (VectorVest, Inc.)
- Trading as a Business Workshop
- VectorVest 7 EOD
- VectorVest 7 RealTime/IntraDay
- VectorVest AutoTester
- VectorVest Educational Services
- VectorVest OnLine
- VectorVest Options Analyzer
- VectorVest ProGraphics v6.0
- VectorVest ProTrader 7
- VectorVest RealTime Derby Tool
- VectorVest Simulator
- VectorVest Variator
- VectorVest Watchdog
