HOT TOPICS LIST
- MACD
- Fibonacci
- RSI
- Gann
- ADXR
- Stochastics
- Volume
- Triangles
- Futures
- Cycles
- Volatility
- ZIGZAG
- MESA
- Retracement
- Aroon
INDICATORS LIST
LIST OF TOPICS
PRINT THIS ARTICLE
by Gary Grosschadl
Last autumn, the NASDAQ displayed a bearish pattern, but then the bear went into hibernation. Now that the bear is awake and flexing his muscle, was the pattern right all along?
Position: Hold
Gary Grosschadl
Independent Canadian equities trader and technical analyst based in Peterborough
Ontario, Canada.
PRINT THIS ARTICLE
WEDGE FORMATIONS
NASDAQ's Tricky Pattern Could Go Either Way
06/20/06 09:53:01 AMby Gary Grosschadl
Last autumn, the NASDAQ displayed a bearish pattern, but then the bear went into hibernation. Now that the bear is awake and flexing his muscle, was the pattern right all along?
Position: Hold
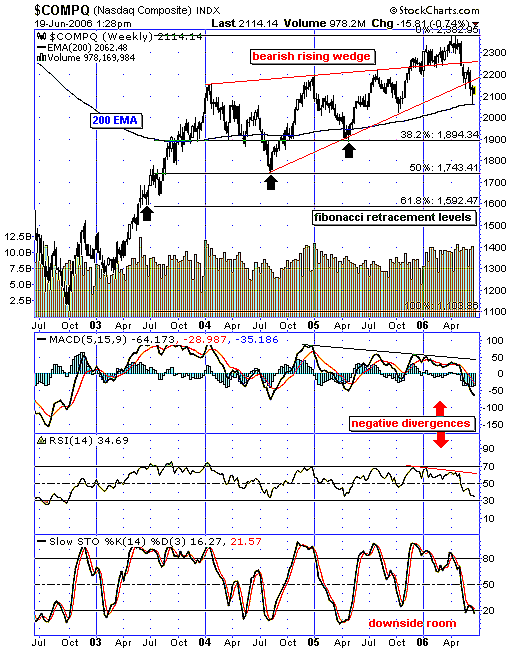
| When classic patterns fail, they can point to a hard run in the opposite direction. Many traders spotted this potentially bearish pattern, referred to as a rising wedge. However, this index continued to break outside of the wedge, seemingly negating the bearish implication. |
| But there were some nagging details that market technicians would have noted. Volume was increasing, but it was not convincing. Breakout volume is ideally large or exceptional, and this was neither. Further, several indicators showed telling negative divergences to price action, as noted via the moving average convergence/divergence (MACD) and the relative strength index (RSI). This, correctly, pointed to a coming decline. |

|
| FIGURE 1: NASDAQ COMPOSITE. Is the previous bearish rising wedge now coming into play? |
| Graphic provided by: StockCharts.com. |
| |
| Now that the pattern has finally broken to the downside, what are the implications? The move below the lower trendline is bearish, but the 200-period exponential moving average (EMA) may provide support, as the hammer candlestick is hinting. The question is whether this is brief support or a lasting bounce. It should be noted that the two previous dips went below this EMA. |
| A move back inside the wedge would be bullish, as the 200-day EMA could be seen as a launchpad for another thrust to challenge new highs. On the other hand, failure between the 200-day EMA and the lower trendline could signal a lower test of support (see Figure 1). |
| Should the bear regain strength, the most common Fibonacci retracement levels (roughly 1/3, 1/2, 2/3) are shown. These take into consideration the high and low on this chart. What makes these levels more compelling are the alignments to previous support levels as highlighted by the black arrows. Should the bear approach these levels, look for bounce opportunities as the streets are bloodied. |
Independent Canadian equities trader and technical analyst based in Peterborough
Ontario, Canada.
| Website: | www.whatsonsale.ca/financial.html |
| E-mail address: | gwg7@sympatico.ca |
Click here for more information about our publications!
Comments
Date: 06/20/06Rank: 5Comment:
Date: 06/21/06Rank: 5Comment:

Request Information From Our Sponsors
- StockCharts.com, Inc.
- Candle Patterns
- Candlestick Charting Explained
- Intermarket Technical Analysis
- John Murphy on Chart Analysis
- John Murphy's Chart Pattern Recognition
- John Murphy's Market Message
- MurphyExplainsMarketAnalysis-Intermarket Analysis
- MurphyExplainsMarketAnalysis-Visual Analysis
- StockCharts.com
- Technical Analysis of the Financial Markets
- The Visual Investor
- VectorVest, Inc.
- Executive Premier Workshop
- One-Day Options Course
- OptionsPro
- Retirement Income Workshop
- Sure-Fire Trading Systems (VectorVest, Inc.)
- Trading as a Business Workshop
- VectorVest 7 EOD
- VectorVest 7 RealTime/IntraDay
- VectorVest AutoTester
- VectorVest Educational Services
- VectorVest OnLine
- VectorVest Options Analyzer
- VectorVest ProGraphics v6.0
- VectorVest ProTrader 7
- VectorVest RealTime Derby Tool
- VectorVest Simulator
- VectorVest Variator
- VectorVest Watchdog
