HOT TOPICS LIST
- MACD
- Fibonacci
- RSI
- Gann
- ADXR
- Stochastics
- Volume
- Triangles
- Futures
- Cycles
- Volatility
- ZIGZAG
- MESA
- Retracement
- Aroon
INDICATORS LIST
LIST OF TOPICS
PRINT THIS ARTICLE
by Koos van der Merwe
After reaching a high of $725 on May 12, the price of London gold has fallen dramatically to $586.50 by June 14. What can we expect next?
Position: Buy
Koos van der Merwe
Has been a technical analyst since 1969, and has worked as a futures and options trader with First Financial Futures in Johannesburg, South Africa.
PRINT THIS ARTICLE
ELLIOTT WAVE
Time To Buy Gold?
06/19/06 08:21:37 AMby Koos van der Merwe
After reaching a high of $725 on May 12, the price of London gold has fallen dramatically to $586.50 by June 14. What can we expect next?
Position: Buy
| The fall in the price of gold was dramatic, especially when you consider that the London gold price fell by $157.25 in little over a month. The elation felt by gold bugs with its equally dramatic rise was dashed, to be replaced by long faces and despair as those holes of hope, namely initial public offerings (IPOs) on new mining exploration companies, started to look far less promising than originally anticipated. |
| But even as US Fed chairman Ben Bernanke spooked the street with his remarks on inflation on June 5, those holes of hope started to fill with promise once again. We all know that the only alternative to inflation is investing in gold, either physical or in a well-managed producing mine. This was a lesson we learned in the 1980s when inflation and the gold price soared to incredible heights. With the chairman's stated view that inflation was once again rearing its ugly head, and with the US economy fearful that rising rates to fight inflation may slow it down, walking the tightrope of the fence may be a feat that the rookie Fed chairman may find difficult to manage. To aid in my decision whether to start buying gold shares, I looked at a number of charts. |

|
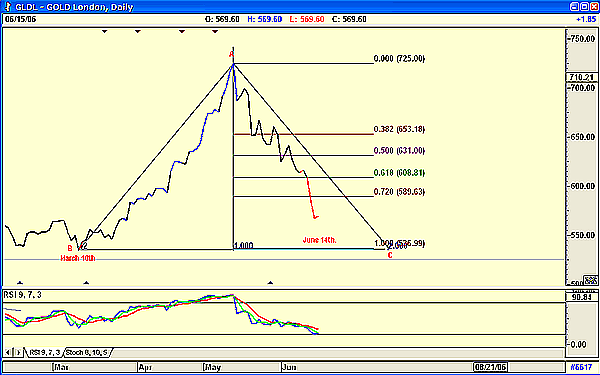
| FIGURE 1: GOLD LONDON, DAILY. This chart shows the rapid rise and equally rapid fall in the gold price since March 10. |
| Graphic provided by: AdvancedGET. |
| |
| Figure 1 is that of the London gold price, showing an isosceles triangle of the rise and fall of the price from March 10 to June 14. The gold price did not completely trace the AC line of the triangle in its fall but it was pretty close, suggesting that the fall was as volatile and rapid as the rise, shown by the AB line. Why the fear? The answer everyone believed at that time was that gold rose relative to the price of oil as that tradable rose to new highs. With the price of oil weakening and probably stabilizing at present levels, does this mean that the gold price has "found a new fear," namely inflation? Or is it anticipating a further increase in the price of oil with world political instability—namely, Iran? Personally, I believe the latter. |

|
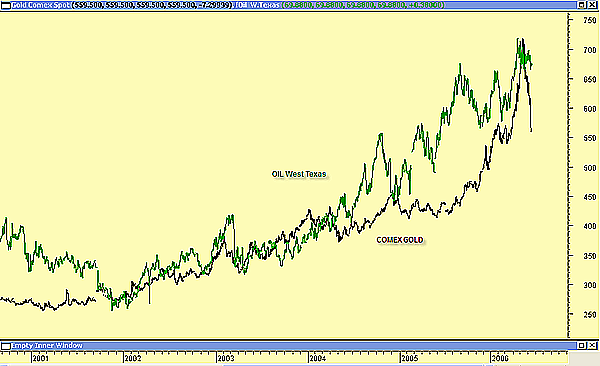
| FIGURE 2: COMEX GOLD. In comparing the rise of COMEX Gold to the rise in the oil price, note how at the start, the oil price led the gold price, but as oil reached higher levels, the gold price lagged. Note how the gold price has fallen dramatically, with a much smaller fall in the oil price. |
| Graphic provided by: MetaStock. |
| |
| Figure 2 shows the rise in the price of oil as reflected by the rise in the price of West Texas oil with the COMEX gold price. The chart shows how, in many instances, the gold price lagged the rise in the price of oil. But the chart also shows how gold fell in far greater proportion to the fall in the oil price. This gives the hint that something else was also feeding the gold price. Charts of a collapsing US dollar was not the answer, and neither was a slowing of the US economy. Whatever the answer, I decided that looking at a chart of the S&P/TSX Capped Gold Index was the best alternative (Figure 3). At least I knew what the market at large was thinking about the gold price. |

|
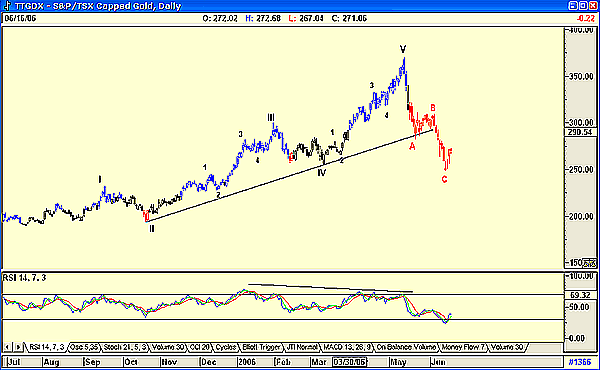
| FIGURE 3: S&P/TSX CAPPED GOLD, DAILY. The Capped Gold Index suggested that the ABC correction is complete, and we can now expect a wave 1 rise. The RSI is showing a buy signal. |
| Graphic provided by: AdvancedGET. |
| |
| Figure 3 shows how the gold price completed a five-wave up wave count, by the end of May. The chart does appear to have completed the ABC correction, even though it has fallen below the fourth wave of lesser degree. The extreme swiftness of the fall also suggests a bear fall, as bear markets collapse far quicker than bull markets rise. Further, the chart also shows that the relative strength index (RSI) has given a very definite buy signal. After examining Figure 3 and other charts of gold and gold-related indexes in my stable of charts, all suggesting a similar pattern, I would therefore be bullish on gold. Does this mean a new rise in oil prices? Does this mean further world tensions? Does this mean a rise in inflation? Honestly, I do not know, but I trade what I see, not what I think the "out there" is telling me. |
Has been a technical analyst since 1969, and has worked as a futures and options trader with First Financial Futures in Johannesburg, South Africa.
| Address: | 3256 West 24th Ave |
| Vancouver, BC | |
| Phone # for sales: | 6042634214 |
| E-mail address: | petroosp@gmail.com |
Click here for more information about our publications!
Comments
Date: 06/20/06Rank: 4Comment:
Date: 06/22/06Rank: 5Comment:

Request Information From Our Sponsors
- StockCharts.com, Inc.
- Candle Patterns
- Candlestick Charting Explained
- Intermarket Technical Analysis
- John Murphy on Chart Analysis
- John Murphy's Chart Pattern Recognition
- John Murphy's Market Message
- MurphyExplainsMarketAnalysis-Intermarket Analysis
- MurphyExplainsMarketAnalysis-Visual Analysis
- StockCharts.com
- Technical Analysis of the Financial Markets
- The Visual Investor
- VectorVest, Inc.
- Executive Premier Workshop
- One-Day Options Course
- OptionsPro
- Retirement Income Workshop
- Sure-Fire Trading Systems (VectorVest, Inc.)
- Trading as a Business Workshop
- VectorVest 7 EOD
- VectorVest 7 RealTime/IntraDay
- VectorVest AutoTester
- VectorVest Educational Services
- VectorVest OnLine
- VectorVest Options Analyzer
- VectorVest ProGraphics v6.0
- VectorVest ProTrader 7
- VectorVest RealTime Derby Tool
- VectorVest Simulator
- VectorVest Variator
- VectorVest Watchdog
