HOT TOPICS LIST
- MACD
- Fibonacci
- RSI
- Gann
- ADXR
- Stochastics
- Volume
- Triangles
- Futures
- Cycles
- Volatility
- ZIGZAG
- MESA
- Retracement
- Aroon
INDICATORS LIST
LIST OF TOPICS
PRINT THIS ARTICLE
by Paolo Pezzutti
The pattern started a reversal to the upside in the short term.
Position: N/A
Paolo Pezzutti
Author of the book "Trading the US Markets - A Comprehensive Guide to US Markets for International Traders and Investors" - Harriman House (July 2008)
PRINT THIS ARTICLE
CANDLESTICK CHARTING
Reversal Pattern: A Candlestick Bullish Engulfing On Dupont
06/19/06 11:40:45 AMby Paolo Pezzutti
The pattern started a reversal to the upside in the short term.
Position: N/A
| In candlestick charting, the engulfing pattern is a major reversal signal with two opposite color real bodies. The second body must begin and end above and below the first body, respectively, giving it the illusion of "engulfing" the first candlestick. The two bodies must be of different colors. The shadows, or "wicks," are irrelevant in this pattern. As a second condition, in order to get a reversal signal, the prices must be in an up- or downtrend. As with other candlestick patterns, the engulfing pattern is more reliable when associated with additional confirmation signals. During a bottoming reversal (when prices are in a downtrend), the first candlestick body will be black, and the second will be white. This shows the switch of traders' attitude toward the market as the bullish forces take control of the bears, ending the second session on a strong, positive close. The opposite is true for bearish engulfing patterns. |
Here are some rules to reinforce the engulfing potential as a reversal pattern: -The first day of the engulfing pattern has a small real body and the second day has a big one. This would indicate a decrease of the prior trend's force and an increase in force of the newborn move. The signal is strong if the second candlestick body is 30% larger than the first. |
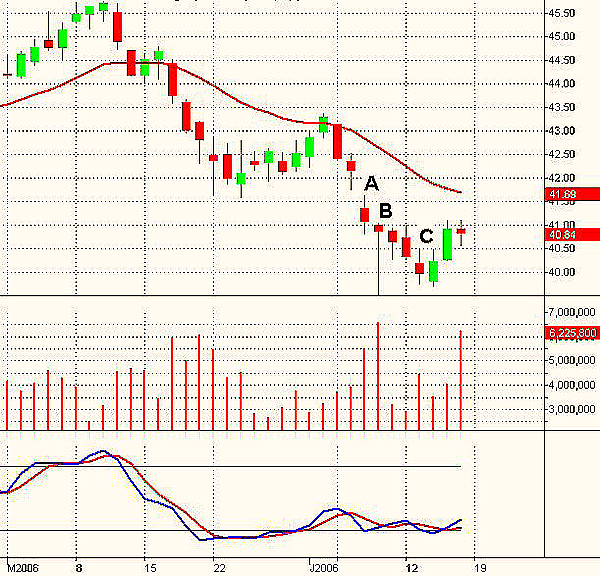
| Let's see the daily chart of Dupont (Figure 1). The stock on June 7 (point A) printed a down gap accelerating to the downside. The next day, a hammer indicated that, very likely, the bears were not able to push prices lower, at least in the short term. During the following three sessions the stock moved lower, but prices did not manage to reach the hammer's low. On June 14 (point C), Dupont printed an engulfing pattern. The open was below the previous day's body and closed above it. This was a sign of strength that was confirmed the following day. Prices have quickly reached the $41 resistance. The bullish engulfing pattern was reinforced by the stochastic in the oversold area, although it was printed on low volume. The pattern is printed in a general condition of weakness, and therefore, it is not going to be a major reversal. However, it could be valid in the short term, applying proper risk management rules. Next, resistances are, respectively, $42 and $43.30. The low of the engulfing bar at $39.70 is now an important support. |

|
| FIGURE 1: DUPONT, DAILY. The stock has printed a bullish engulfing pattern that has initiated a short-term reaction after the one-month downtrend that brought prices more than 10% lower. |
| Graphic provided by: TradeStation. |
| |
Author of the book "Trading the US Markets - A Comprehensive Guide to US Markets for International Traders and Investors" - Harriman House (July 2008)
| Address: | VIA ROBERTO AGO 26 POSTAL CODE 00166 |
| Rome, ITALY | |
| Phone # for sales: | +393357540708 |
| E-mail address: | pezzutti.paolo@tiscali.it |
Click here for more information about our publications!
Comments
Date: 06/20/06Rank: 3Comment:

|

Request Information From Our Sponsors
- VectorVest, Inc.
- Executive Premier Workshop
- One-Day Options Course
- OptionsPro
- Retirement Income Workshop
- Sure-Fire Trading Systems (VectorVest, Inc.)
- Trading as a Business Workshop
- VectorVest 7 EOD
- VectorVest 7 RealTime/IntraDay
- VectorVest AutoTester
- VectorVest Educational Services
- VectorVest OnLine
- VectorVest Options Analyzer
- VectorVest ProGraphics v6.0
- VectorVest ProTrader 7
- VectorVest RealTime Derby Tool
- VectorVest Simulator
- VectorVest Variator
- VectorVest Watchdog
- StockCharts.com, Inc.
- Candle Patterns
- Candlestick Charting Explained
- Intermarket Technical Analysis
- John Murphy on Chart Analysis
- John Murphy's Chart Pattern Recognition
- John Murphy's Market Message
- MurphyExplainsMarketAnalysis-Intermarket Analysis
- MurphyExplainsMarketAnalysis-Visual Analysis
- StockCharts.com
- Technical Analysis of the Financial Markets
- The Visual Investor
