HOT TOPICS LIST
- MACD
- Fibonacci
- RSI
- Gann
- ADXR
- Stochastics
- Volume
- Triangles
- Futures
- Cycles
- Volatility
- ZIGZAG
- MESA
- Retracement
- Aroon
INDICATORS LIST
LIST OF TOPICS
PRINT THIS ARTICLE
by Paolo Pezzutti
The pattern failed, squeezing the last bulls before the market reversed to the upside to find a balance at higher levels.
Position: N/A
Paolo Pezzutti
Author of the book "Trading the US Markets - A Comprehensive Guide to US Markets for International Traders and Investors" - Harriman House (July 2008)
PRINT THIS ARTICLE
CANDLESTICK CHARTING
Reversal Pattern: A Candlestick Hammer On Emini S&P
06/19/06 12:04:56 PMby Paolo Pezzutti
The pattern failed, squeezing the last bulls before the market reversed to the upside to find a balance at higher levels.
Position: N/A
The hammer is one of the most famous candle reversal patterns. For those of you who are new to candlestick charting, here are the rules that apply to the hammer pattern: -The hammer appears in a downtrend Although the real body of the hammer can be white or black, it is slightly more bullish if the real body of the hammer is white. Interestingly, the Japanese word for this line is takuri, roughly meaning "trying to gauge depth." |
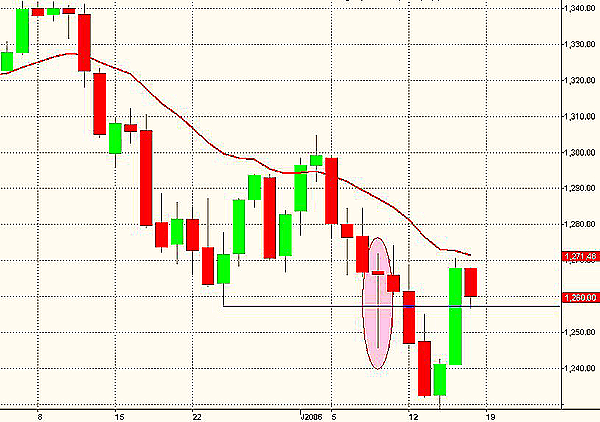
| Now let's look at the emini S&P daily chart in Figure 1. You can see that the market sold off sharply between May 11 and the beginning of June. This was associated with an increase in volatility. The session on June 8 printed a pattern that complied with the rules. The market opened at 1267, traded down to 1245.75, then rallied, finishing the session at 1272. The range of 26.25 points is significant. Up until this day, the market had spent the past weeks trading down. The bulls had been beaten all along the downtrend. A hammer is formed because of a shift in the balance between bulls and bears over the course of a trading session. But on that day, bulls fought until the close of the day. The market dropped heavily, but then stopped the selloff and prices recovered. The bulls kept buying until prices got back very near the open. In a market where the bears were in control, the bulls managed by the end of the session to level off things. Psychologically, this was a strong signal, especially for bears, basically saying: "Watch out! Below a certain level you are ready to buy whatever you want to throw at the market!" Candlesticks can be combined with basic support and resistance analysis. Analyzing the daily chart, there was a support level at 1257, the low of May 24. The bears took prices to print a low below the support on the day the hammer formed, but failed to close lower. This fact is important, as it signaled the validity of the support level. So it seemed that everything was set to have an up move the days following the hammer. |

|
| FIGURE 1: EMINI S&P, DAILY. A hammer at important support levels failed to confirm the bullish reversal indication during the following trading sessions. Only after three consecutive negative sessions did prices manage to reverse. |
| Graphic provided by: TradeStation. |
| |
| Unfortunately, markets do not work exactly like this. The next days did not confirm the hammer's indications; in fact, prices sold off to print new lows and squeeze the last bulls. Only after three consecutive negative sessions, the emini reversed to the upside, going back into the previous trading range and reaching again the levels of the hammer's body. Entering a long trade would have probably been a loser. A natural stop-loss, in fact, would have been below the low of the hammer. When prices penetrated that level, they accelerated to the downside. But what seemed to be the capitulation of the bulls actually took away the last energy and steam from the bears. Not closing the position would have been risky, however. It is a difficult balance that depends on your trading style. |
| Now, the emini is confronting the 1260 resistance, which could open the way to the 1300 level. |
Author of the book "Trading the US Markets - A Comprehensive Guide to US Markets for International Traders and Investors" - Harriman House (July 2008)
| Address: | VIA ROBERTO AGO 26 POSTAL CODE 00166 |
| Rome, ITALY | |
| Phone # for sales: | +393357540708 |
| E-mail address: | pezzutti.paolo@tiscali.it |
Click here for more information about our publications!
Comments
Date: 06/20/06Rank: 3Comment:

Request Information From Our Sponsors
- VectorVest, Inc.
- Executive Premier Workshop
- One-Day Options Course
- OptionsPro
- Retirement Income Workshop
- Sure-Fire Trading Systems (VectorVest, Inc.)
- Trading as a Business Workshop
- VectorVest 7 EOD
- VectorVest 7 RealTime/IntraDay
- VectorVest AutoTester
- VectorVest Educational Services
- VectorVest OnLine
- VectorVest Options Analyzer
- VectorVest ProGraphics v6.0
- VectorVest ProTrader 7
- VectorVest RealTime Derby Tool
- VectorVest Simulator
- VectorVest Variator
- VectorVest Watchdog
- StockCharts.com, Inc.
- Candle Patterns
- Candlestick Charting Explained
- Intermarket Technical Analysis
- John Murphy on Chart Analysis
- John Murphy's Chart Pattern Recognition
- John Murphy's Market Message
- MurphyExplainsMarketAnalysis-Intermarket Analysis
- MurphyExplainsMarketAnalysis-Visual Analysis
- StockCharts.com
- Technical Analysis of the Financial Markets
- The Visual Investor
