HOT TOPICS LIST
- MACD
- Fibonacci
- RSI
- Gann
- ADXR
- Stochastics
- Volume
- Triangles
- Futures
- Cycles
- Volatility
- ZIGZAG
- MESA
- Retracement
- Aroon
INDICATORS LIST
LIST OF TOPICS
PRINT THIS ARTICLE
by David Penn
Looking for a sector that is still in a bull market? The answer may be in your pocket.
Position: N/A
David Penn
Technical Writer for Technical Analysis of STOCKS & COMMODITIES magazine, Working-Money.com, and Traders.com Advantage.
PRINT THIS ARTICLE
SECTOR INVESTING
TTT For TTH
06/16/06 08:44:13 AMby David Penn
Looking for a sector that is still in a bull market? The answer may be in your pocket.
Position: N/A
| Anybody who's spent any time at all on an Internet message-board knows that the acronym "TTT" means "to the top." It's e-shorthand for a message thread that a person doesn't want to add any comment to, but nevertheless wants to make sure that as many as possible read what's in the thread. Since each new thread pushes the old threads lower (and eventually to a second and third page), adding a message that simply reads "TTT" is a way to keep a topic from being overlooked or forgotten as new threads are created and added. |

|
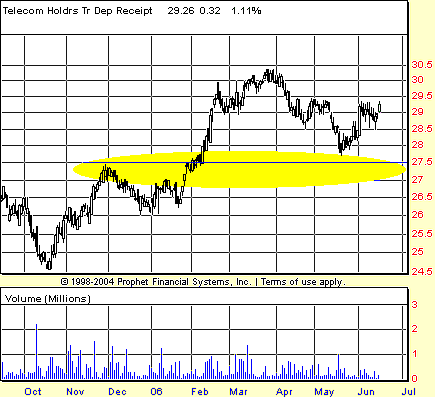
| FIGURE 1: TELECOM HOLDRS. After coming into 2006 on a tear and having an excellent January and February, TTH slipped into a slump before pulling out of it. |
| Graphic provided by: Prophet Financial, Inc. |
| |
| Lately, what's been added to the message-board of trader attention has been the woes of housing stocks, semiconductor stocks, gold stocks, and most recently, banking stocks (see my Traders.com Advantage article, "Bye-Bye Banks," June 14, 2006). And what may have been overlooked is the relatively bullish behavior of telecom stocks. True enough, after coming into 2006 on a tear and having an excellent January and February, telecom stocks (as measured by the HOLDRS, TTH) slipped into a slump. |
| However, as Figure 1 shows, that slump in telecommunications stocks appears to have ended. Note how the correction that began in latest March--a correction with a distinct, three-segmented, ABC pattern--found support at approximately the 27.5 level. This support level coincides with a former resistance level left over from the TTH's initial rally off the bottom back in the autumn of 2005. The spring 2006 correction didn't bring TTH all the way to the 27.5 level; the correction low was 27.72. But it was certainly close enough for a test. And TTH's behavior since then, rallying a point and a half over the next few weeks, suggests that the test was successful. |

|
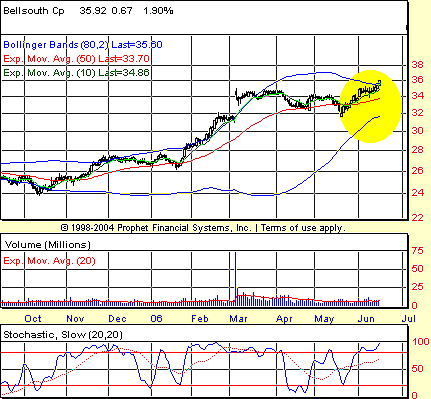
| FIGURE 2: BELL SOUTH. BLS broke out above its 50-day EMA as well as its 10-day EMA, and also made a stochastic breakout. |
| Graphic provided by: Prophet Financial, Inc. |
| |
| There are a number of ways to take advantage of any bullishness in this sector, apart from the obvious step of buying the telecom HOLDRS. There are equipment makers, service providers, and other companies who benefit from any overflow of telecom coffers. Looking at TTH this morning, I went straight to the HOLDRS website (holdrs.com) to look up the components of the exchange traded fund. The top four stocks in TTH by weighting were AT&T, Verizon, Sprint, and Bell South. Of the four, the most bullish charts were clearly AT&T (T) and Bell South (BLS). In both of these instances, T and BLS had broken out above their 50-day exponential moving averages (EMAs) as well as their 10-day EMAs. Both stocks had also made stochastic breakouts (see my Working Money article "BOSO" from October 5, 2005 for more), a particularly bullish development given the broader environment for stocks in late May and early June. |
| One of the things about BLS that stands out compared to T is the fact that BLS is making new highs while T is looking to challenge year-to-date highs from February (Figure 2). Another potential eyebrow-raiser for Bell South is the way its Bollinger Bands have tightened over the past few weeks. This contraction in volatility suggests the potential--as it did in the autumn of 2005--of a significant move in the near term. And while no specific directionality is implied by the Bollinger Bands, the context in which this contraction of volatility is taking place--an oversold broader market, cyclical lows in the Dow Jones Industrial Average, and strength in the sector--suggests that additional upside is more likely than renewed downside. |
Technical Writer for Technical Analysis of STOCKS & COMMODITIES magazine, Working-Money.com, and Traders.com Advantage.
| Title: | Technical Writer |
| Company: | Technical Analysis, Inc. |
| Address: | 4757 California Avenue SW |
| Seattle, WA 98116 | |
| Phone # for sales: | 206 938 0570 |
| Fax: | 206 938 1307 |
| Website: | www.Traders.com |
| E-mail address: | DPenn@traders.com |
Traders' Resource Links | |
| Charting the Stock Market: The Wyckoff Method -- Books | |
| Working-Money.com -- Online Trading Services | |
| Traders.com Advantage -- Online Trading Services | |
| Technical Analysis of Stocks & Commodities -- Publications and Newsletters | |
| Working Money, at Working-Money.com -- Publications and Newsletters | |
| Traders.com Advantage -- Publications and Newsletters | |
| Professional Traders Starter Kit -- Software | |
Click here for more information about our publications!
Comments
Date: 06/17/06Rank: 5Comment:
Date: 06/17/06Rank: 4Comment:

Request Information From Our Sponsors
- StockCharts.com, Inc.
- Candle Patterns
- Candlestick Charting Explained
- Intermarket Technical Analysis
- John Murphy on Chart Analysis
- John Murphy's Chart Pattern Recognition
- John Murphy's Market Message
- MurphyExplainsMarketAnalysis-Intermarket Analysis
- MurphyExplainsMarketAnalysis-Visual Analysis
- StockCharts.com
- Technical Analysis of the Financial Markets
- The Visual Investor
- VectorVest, Inc.
- Executive Premier Workshop
- One-Day Options Course
- OptionsPro
- Retirement Income Workshop
- Sure-Fire Trading Systems (VectorVest, Inc.)
- Trading as a Business Workshop
- VectorVest 7 EOD
- VectorVest 7 RealTime/IntraDay
- VectorVest AutoTester
- VectorVest Educational Services
- VectorVest OnLine
- VectorVest Options Analyzer
- VectorVest ProGraphics v6.0
- VectorVest ProTrader 7
- VectorVest RealTime Derby Tool
- VectorVest Simulator
- VectorVest Variator
- VectorVest Watchdog
