HOT TOPICS LIST
- MACD
- Fibonacci
- RSI
- Gann
- ADXR
- Stochastics
- Volume
- Triangles
- Futures
- Cycles
- Volatility
- ZIGZAG
- MESA
- Retracement
- Aroon
INDICATORS LIST
LIST OF TOPICS
PRINT THIS ARTICLE
by Luis Ferro
A strong medium-term correction in Coach was accompanied by a substantial increase in trading volume. This highly bearish pattern, combined with a long-term triple top, forecasts lower prices for the stock.
Position: Sell
Luis Ferro
Trader and technical analyst living in Bern, Switzerland. A full member of the STA, currently enrolled in the DITA program and the CMT program.
PRINT THIS ARTICLE
VOLUME
Anticipating A Breakdown In Coach
06/15/06 09:58:31 AMby Luis Ferro
A strong medium-term correction in Coach was accompanied by a substantial increase in trading volume. This highly bearish pattern, combined with a long-term triple top, forecasts lower prices for the stock.
Position: Sell
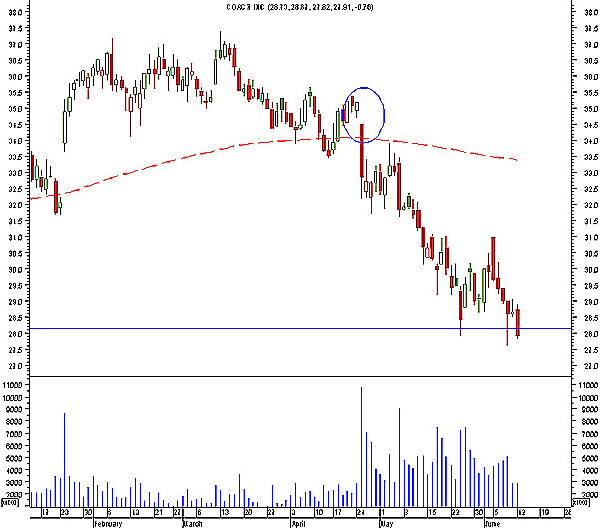
| A blue circle highlights an important gap that occurred on April 25 in Coach (COH), as can be seen in Figure 1. The high volume on the day of the gap and the fact that the stock broke below a short-term congestion area suggested that this was probably a breakaway gap. COH started a correction that lasted for four weeks and that brought prices to the 27.9 level. The very short-term retracement of this correction that followed took prices to 31, but recently, COH has been trading at the 28 level again. |

|
| FIGURE 1: COACH, DAILY. Here's a candlestick chart with a 200-day simple moving average |
| Graphic provided by: MetaStock. |
| |
| Volume has been very high since the downtrend began, which is highly significant. Volume increase is considered essential in the case of uptrends, because a stock needs strong buying in order to continue to rise, but it is not so important in the case of downtrends, because a stock can fall simply due to a lack of interest. But if a price correction is accompanied by strong volume, as in this case, it normally indicates strong selling. This volume pattern suggests that this downward movement is not a correction within a longer-term uptrend, but instead, the first leg of a new larger downtrend. The red line in Figure 2 is the 200-day simple moving average. Of all the available long-term indicators, this moving average is probably the most followed, and the cross below the moving average is highly bearish, especially since the moving average has already stopped rising and is starting to decline. |

|
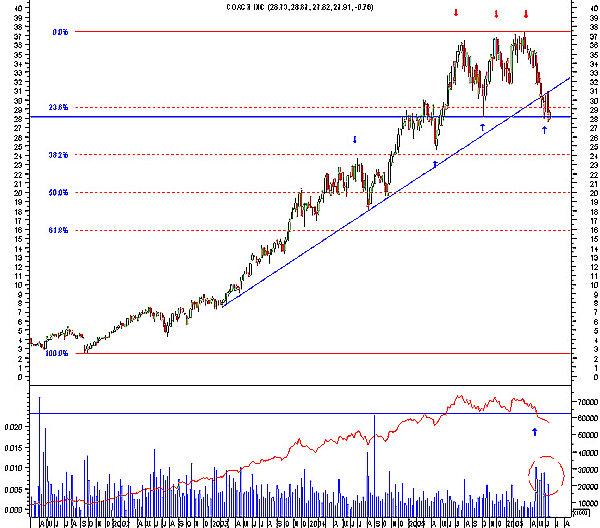
| FIGURE 2: COACH, WEEKLY. This weekly chart is shown with support and resistance levels, Fibonacci retracements, and relative strength in the lower window. The recent volume increase is highlighted with a red circle. |
| Graphic provided by: MetaStock. |
| |
| The weekly chart (Figure 2) shows the long-term rally that started in 2001 and took prices from 2.5 to 37.5 by June 2006. Several technical factors, however, suggest that this trend has probably come to an end and that a correction might be imminent. Coach has recently crossed below the uptrend line, and this is frequently one of the first signs of a change in the trend. Also on the lower window of the weekly chart is the relative strength index (RSI), which in this case compares the performance of the stock versus the Standard & Poor's 500. After several years of performing above the S&P 500, the recent behavior of COH has been poor and the indicator has already broken below a previous low (marked with a blue arrow). It is very common for a break in relative strength to precede a break in price itself. Finally, and more important, there is the formation of a triple-top pattern. This is a highly bearish pattern that still requires that Coach fall decisively below the 28 level to be completed, and if this happens, the trend will most likely reverse. |
| The classical way of calculating price objectives is that from the point of the breakout, prices should move at least a distance equal to the height of the pattern. Since the highest point in the triple top was at 37.4 and the breakout level is at 28, the height of the pattern is 9.8. Since the breakout point is at 28, we reach a target price of 18.2 (28-9.8). However, there are two strong levels that can stop the downtrend before this price is reached. One is at 24, where there is a combination of previous support/resistance levels with the 38.2% Fibonacci retracement. The second is at 20, where again there is a combination of old support/resistance with the 50% Fibonacci retracement. Of these two levels, the second is probably the strongest, because the previous support and resistance level have been touched more times, the 50% retracement is more important than the 38.2% and also because multiples of 10 tend to act as support and resistance. |
| Risk management and stops must always be used, even though the case for a strong downtrend is very strong. Trading is, above all, a probability game, and things can always turn out very differently than what was anticipated. |
Trader and technical analyst living in Bern, Switzerland. A full member of the STA, currently enrolled in the DITA program and the CMT program.
| Address: | Switzerland |
| E-mail address: | luispgsf@yahoo.com |
Click here for more information about our publications!
Comments
Date: 06/17/06Rank: 4Comment:

Request Information From Our Sponsors
- StockCharts.com, Inc.
- Candle Patterns
- Candlestick Charting Explained
- Intermarket Technical Analysis
- John Murphy on Chart Analysis
- John Murphy's Chart Pattern Recognition
- John Murphy's Market Message
- MurphyExplainsMarketAnalysis-Intermarket Analysis
- MurphyExplainsMarketAnalysis-Visual Analysis
- StockCharts.com
- Technical Analysis of the Financial Markets
- The Visual Investor
- VectorVest, Inc.
- Executive Premier Workshop
- One-Day Options Course
- OptionsPro
- Retirement Income Workshop
- Sure-Fire Trading Systems (VectorVest, Inc.)
- Trading as a Business Workshop
- VectorVest 7 EOD
- VectorVest 7 RealTime/IntraDay
- VectorVest AutoTester
- VectorVest Educational Services
- VectorVest OnLine
- VectorVest Options Analyzer
- VectorVest ProGraphics v6.0
- VectorVest ProTrader 7
- VectorVest RealTime Derby Tool
- VectorVest Simulator
- VectorVest Variator
- VectorVest Watchdog
