HOT TOPICS LIST
- MACD
- Fibonacci
- RSI
- Gann
- ADXR
- Stochastics
- Volume
- Triangles
- Futures
- Cycles
- Volatility
- ZIGZAG
- MESA
- Retracement
- Aroon
INDICATORS LIST
LIST OF TOPICS
PRINT THIS ARTICLE
by David Penn
The early summer correction takes its toll on brokers and banks.
Position: N/A
David Penn
Technical Writer for Technical Analysis of STOCKS & COMMODITIES magazine, Working-Money.com, and Traders.com Advantage.
PRINT THIS ARTICLE
SECTOR INVESTING
Bye-Bye, Banks
06/14/06 11:45:38 AMby David Penn
The early summer correction takes its toll on brokers and banks.
Position: N/A
| I was listening to Gary Kaltbaum of Investor's Edge (garyk.com) talk about the "new group" that had shown clearly that it had topped during the week of June options expiration. As I quickly scanned my own watchlists of stocks and sectors, it became obvious that this group was the financials. Just for kicks, I pulled out my copy of Yale Hirsch's The Stock Traders Almanac (a must-own volume for traders if ever there was one) and turned to the "sector seasonality" section. Why? Because I wanted to see if the emergence of weakness in the financial stocks at this time was just another one of those things that Hirsch's volume had anticipated. So was that the case? |

|
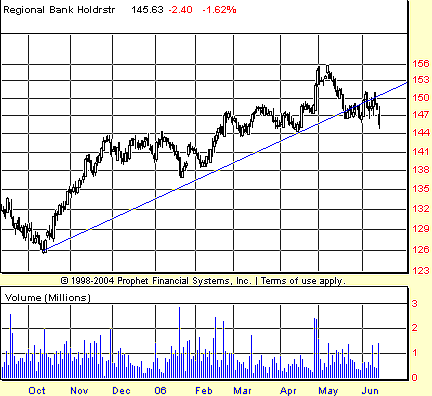
| FIGURE 1: REGIONAL BANK HOLDRS, DAILY. After a multimonth run, the regional bank HOLDRS slip below a major trendline in May and break down below a key low by mid-June. |
| Graphic provided by: Prophet Financial, Inc. |
| |
| The answer to that question would be an unqualified "Yes." According to The Stock Traders Almanac, banking stocks tend to shine during the period from October to June. Thus, is it any surprise that, as June moves toward mid-month, financial stocks would be falling from negative divergences, breaking trendlines, and slipping below support? |
| Figure 1 shows RKH, or the regional bank HOLDRS, since they bottomed in October 2005. True to the "playbook," an investor who bought into RKH at the beginning of October and sold at the beginning of the following June would have been richly rewarded to the tune of a 14% increase over eight months (some 18 points). In May, RKH closed below the trendline that provided support for this advance. This trendline break set up a key low, a potential support point that would likely be tested during a post-break bounce. That bounce arrived a few days afterward in early June as RKH bounded from the 147 level back to barely above 150. However, that bounce was quite short-lived. RKH reversed, moving back below the trendline, and on Tuesday, June 13, slipped below the key low I mentioned a moment ago, the source of potential support from the initial trendline break. |

|
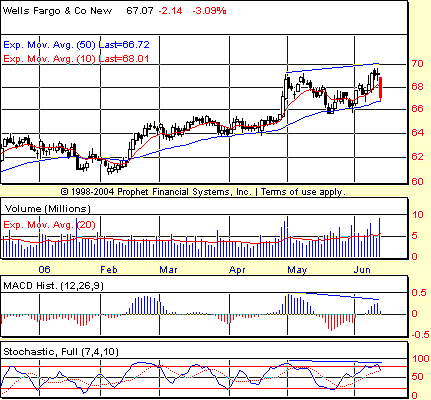
| FIGURE 2: WELLS FARGO & CO., DAILY. The negative divergences in both the MACD histogram and the stochastic were strong signals that the advance in WFC was running out of momentum to the upside and was increasingly ripe for correction—if not reversal. |
| Graphic provided by: Prophet Financial, Inc. |
| |
| One of the stronger financial stocks, Wells Fargo (WFC), provides a glimpse into how the banks got into trouble. Note Figure 2. This stock broke out at the very end of April to set a significant high near 69. WFC pulled back over the course of May, found support at the 50-day exponential moving average (EMA), and rallied to make a new high in the first half of June. Unfortunately for those long in Wells Fargo, the higher highs in the stock from April to June were matched by lower highs in both the stochastic and the moving average convergence/divergence (MACD) histogram. This pattern—higher highs in price matched with lower highs in the stochastic and/or MACD histogram—is characteristic of a negative divergence. And negative divergences tend to mean sideways prices at best, lower prices—sometimes dramatically so—at worst. |
| There is significant support for WFC at the 64 level, so any decline that reaches that point may find itself limited by the lows of the congestion range that dominated the stock over the course of March and April. Other financial stocks, it should be said, are in much worse shape, and it is those stocks that are probably better candidates for shorts than is WFC, which, for all its woes, is still above the 50-day EMA as of this writing. Some of those financials that appear weaker than WFC include such notables as Bank of America, Citigroup, and Comerica. |
Technical Writer for Technical Analysis of STOCKS & COMMODITIES magazine, Working-Money.com, and Traders.com Advantage.
| Title: | Technical Writer |
| Company: | Technical Analysis, Inc. |
| Address: | 4757 California Avenue SW |
| Seattle, WA 98116 | |
| Phone # for sales: | 206 938 0570 |
| Fax: | 206 938 1307 |
| Website: | www.Traders.com |
| E-mail address: | DPenn@traders.com |
Traders' Resource Links | |
| Charting the Stock Market: The Wyckoff Method -- Books | |
| Working-Money.com -- Online Trading Services | |
| Traders.com Advantage -- Online Trading Services | |
| Technical Analysis of Stocks & Commodities -- Publications and Newsletters | |
| Working Money, at Working-Money.com -- Publications and Newsletters | |
| Traders.com Advantage -- Publications and Newsletters | |
| Professional Traders Starter Kit -- Software | |
Click here for more information about our publications!
Comments
Date: 06/14/06Rank: 3Comment:
Date: 06/15/06Rank: 4Comment:

Request Information From Our Sponsors
- StockCharts.com, Inc.
- Candle Patterns
- Candlestick Charting Explained
- Intermarket Technical Analysis
- John Murphy on Chart Analysis
- John Murphy's Chart Pattern Recognition
- John Murphy's Market Message
- MurphyExplainsMarketAnalysis-Intermarket Analysis
- MurphyExplainsMarketAnalysis-Visual Analysis
- StockCharts.com
- Technical Analysis of the Financial Markets
- The Visual Investor
- VectorVest, Inc.
- Executive Premier Workshop
- One-Day Options Course
- OptionsPro
- Retirement Income Workshop
- Sure-Fire Trading Systems (VectorVest, Inc.)
- Trading as a Business Workshop
- VectorVest 7 EOD
- VectorVest 7 RealTime/IntraDay
- VectorVest AutoTester
- VectorVest Educational Services
- VectorVest OnLine
- VectorVest Options Analyzer
- VectorVest ProGraphics v6.0
- VectorVest ProTrader 7
- VectorVest RealTime Derby Tool
- VectorVest Simulator
- VectorVest Variator
- VectorVest Watchdog
