HOT TOPICS LIST
- MACD
- Fibonacci
- RSI
- Gann
- ADXR
- Stochastics
- Volume
- Triangles
- Futures
- Cycles
- Volatility
- ZIGZAG
- MESA
- Retracement
- Aroon
INDICATORS LIST
LIST OF TOPICS
PRINT THIS ARTICLE
by Gary Grosschadl
Sigma-Aldrich Corp., a leading life science and high technology company, may be topping in a potentially weak pattern.
Position: Sell
Gary Grosschadl
Independent Canadian equities trader and technical analyst based in Peterborough
Ontario, Canada.
PRINT THIS ARTICLE
DOUBLE TOPS
Sigma-Aldrich May Be Topping
06/12/06 01:01:24 PMby Gary Grosschadl
Sigma-Aldrich Corp., a leading life science and high technology company, may be topping in a potentially weak pattern.
Position: Sell
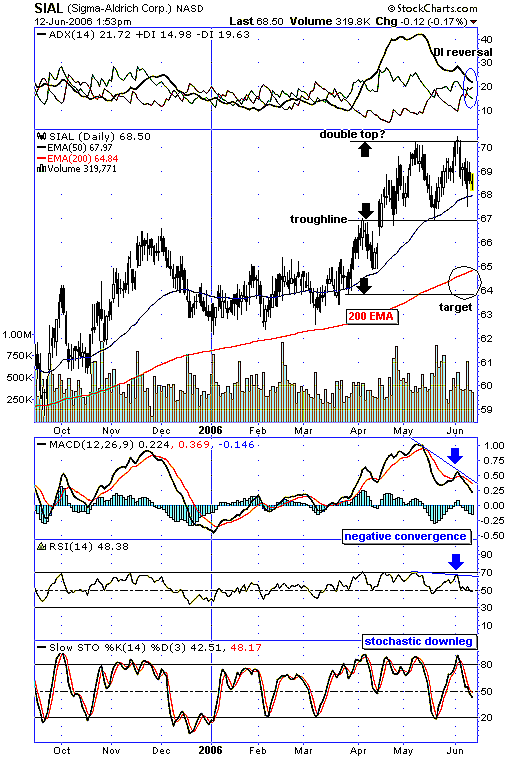
| Sigma-Aldrich, operating in 35 countries, recently hit all-time highs, touching $70. Several indications hint at a possible double top in the making. |
| At the top of the chart (Figure 1), the directional movement indicator has three components. The directional movement index (DIs) are the positive and negative directional indicators, and they have just come up with a bearish cross. This suggests a shift to bearish power. Once -DI (in red) rises above the average directional movement index (ADX), then this bearish trend has some confirmation. |

|
| FIGURE 1: SIGMA-ALDRICH, DAILY. Here's a possible double top. |
| Graphic provided by: StockCharts.com. |
| |
| The indicators below the chart all have a negative connotation. The moving average convergence/divergence (MACD) shows negative divergence to price action and has a definite downward bias. This trend strength indicator is likely to test support at the zero line. The relative strength index (RSI) also shows a negative divergence to price action and has just slipped below what is often key, the 50 level support. Meanwhile, the stochastic oscillator is in a definite downtrend, also slipping below its 50 level. |
| The target zone for further downside encompasses the pattern fullfilment mark just under $64 (equal to the distance from the top to the troughline as applied to the downside break) and the oft-watched 200-day exponential moving average (EMA). A reversal attempt may occur at these levels, which could be an attractive entry level for new buyers. Failure here could drive the stock to previous support at $61 or $59. |
| Time will tell if this double top candidate survives the troughline test. If this level holds, the stock may go into a sideways trend. |
Independent Canadian equities trader and technical analyst based in Peterborough
Ontario, Canada.
| Website: | www.whatsonsale.ca/financial.html |
| E-mail address: | gwg7@sympatico.ca |
Click here for more information about our publications!
Comments
Date: 06/14/06Rank: 5Comment:

Request Information From Our Sponsors
- StockCharts.com, Inc.
- Candle Patterns
- Candlestick Charting Explained
- Intermarket Technical Analysis
- John Murphy on Chart Analysis
- John Murphy's Chart Pattern Recognition
- John Murphy's Market Message
- MurphyExplainsMarketAnalysis-Intermarket Analysis
- MurphyExplainsMarketAnalysis-Visual Analysis
- StockCharts.com
- Technical Analysis of the Financial Markets
- The Visual Investor
- VectorVest, Inc.
- Executive Premier Workshop
- One-Day Options Course
- OptionsPro
- Retirement Income Workshop
- Sure-Fire Trading Systems (VectorVest, Inc.)
- Trading as a Business Workshop
- VectorVest 7 EOD
- VectorVest 7 RealTime/IntraDay
- VectorVest AutoTester
- VectorVest Educational Services
- VectorVest OnLine
- VectorVest Options Analyzer
- VectorVest ProGraphics v6.0
- VectorVest ProTrader 7
- VectorVest RealTime Derby Tool
- VectorVest Simulator
- VectorVest Variator
- VectorVest Watchdog
