HOT TOPICS LIST
- MACD
- Fibonacci
- RSI
- Gann
- ADXR
- Stochastics
- Volume
- Triangles
- Futures
- Cycles
- Volatility
- ZIGZAG
- MESA
- Retracement
- Aroon
INDICATORS LIST
LIST OF TOPICS
PRINT THIS ARTICLE
by Koos van der Merwe
Investors fear rate hikes -- political tension -- economic slowdown. Investors fear... fear .... fear... . Is it time to buy?
Position: Hold
Koos van der Merwe
Has been a technical analyst since 1969, and has worked as a futures and options trader with First Financial Futures in Johannesburg, South Africa.
PRINT THIS ARTICLE
REL. STR OSCILL
Is Dell Bouncing Off A Bottom?
06/07/06 01:55:13 PMby Koos van der Merwe
Investors fear rate hikes -- political tension -- economic slowdown. Investors fear... fear .... fear... . Is it time to buy?
Position: Hold
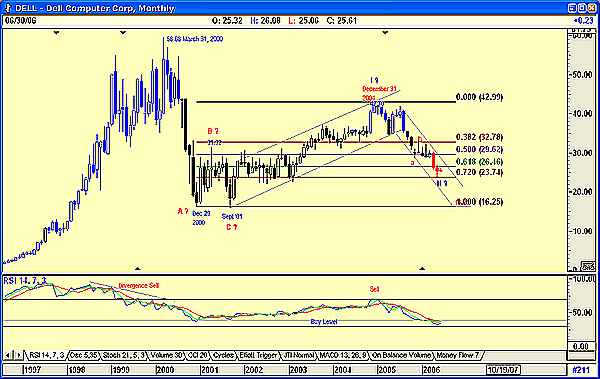
| Being a contrarian can be very profitable, but only when the blood is running in the streets. To buy too early, no matter how solid the company and how far it has fallen, can be disastrous. With the Dow Jones Industrial Average (DJIA) falling almost daily, with a new Fed chairman talking about possible stagflation, and a second-year Presidential cycle all negatives, we start casting a net, looking for gems that should be bought. Is Dell one of them? Let us have a look. Figure 1 is a monthly chart that shows that Dell reached a high of 58.68 on March 30, 2000. As with all other stocks after the tech bubble burst, it fell to a low of $16.25 by December 2000. It then rose to $31.32, and fell again to form a double bottom by September 2001. From there, Dell followed the market as stocks recovered and reached a high of $42.70 by December 2004 before falling to present levels. The relative strength index (RSI) shown is suggesting an oversold level but has not given a buy signal. Does this mean that the share price will fall to $16.25 before it gives a buy, or will the share price find support before then? A Fibonacci retracement does show that Dell has reached the 72% retracement level, a Level 1 usually assign to a wave 2 retracement. |

|
| FIGURE 1: DELL, MONTHLY. Dell reached a high of 58.68 at the end of March. |
| Graphic provided by: AdvancedGET. |
| |
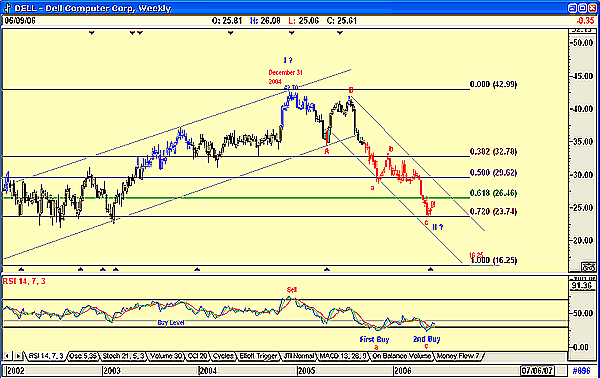
| The RSI on the weekly chart (Figure 2), on the other hand, is showing a second buy signal. The first one failed for a long-term buy and had we followed it and bought, the stock would have been stopped out with a small profit. The price at point a turned on the 50% retracement level, sucking in many who believe in a Dell turnaround. The price at point c may be just as tempting, and with Investors seeing little room for further downside may see a large influx of buyers. News has been reported that Dell has bowed to customer demands and will start using Advanced Micro Devices' chips in its high-end servers, and it's teaming up with Google's top preinstall web browser search toolbar on its computers. |

|
| FIGURE 2: DELL, WEEKLY. The RSI is showing a second buy signal after the first failed for a long-term buy. |
| Graphic provided by: AdvancedGET. |
| |
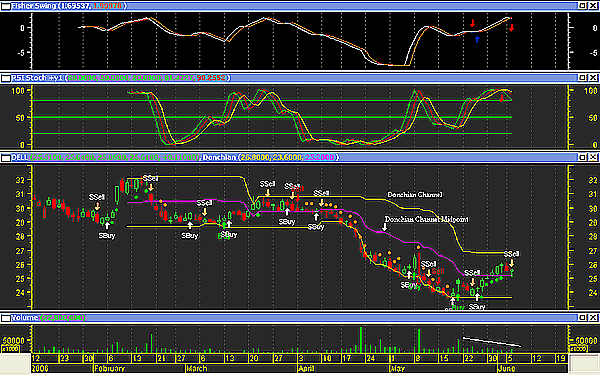
Finally, a look at my daily short-term chart (Figure 3) shows the following:a. The Fisher swing indicator is showing a sell signal |

|
| FIGURE 3: DELL, DAILY. Volume has decreased, suggesting strength as the price falls. |
| Graphic provided by: MetaStock. |
| |
| To conclude, the monthly and weekly charts of Dell are suggesting a buy in the near future. Daily charts are suggesting a "not just yet." All formulas for the MetaStock chart are available on request. |
Has been a technical analyst since 1969, and has worked as a futures and options trader with First Financial Futures in Johannesburg, South Africa.
| Address: | 3256 West 24th Ave |
| Vancouver, BC | |
| Phone # for sales: | 6042634214 |
| E-mail address: | petroosp@gmail.com |
Click here for more information about our publications!
Comments
Date: 06/07/06Rank: 3Comment:
Date: 06/13/06Rank: 3Comment:

Request Information From Our Sponsors
- StockCharts.com, Inc.
- Candle Patterns
- Candlestick Charting Explained
- Intermarket Technical Analysis
- John Murphy on Chart Analysis
- John Murphy's Chart Pattern Recognition
- John Murphy's Market Message
- MurphyExplainsMarketAnalysis-Intermarket Analysis
- MurphyExplainsMarketAnalysis-Visual Analysis
- StockCharts.com
- Technical Analysis of the Financial Markets
- The Visual Investor
- VectorVest, Inc.
- Executive Premier Workshop
- One-Day Options Course
- OptionsPro
- Retirement Income Workshop
- Sure-Fire Trading Systems (VectorVest, Inc.)
- Trading as a Business Workshop
- VectorVest 7 EOD
- VectorVest 7 RealTime/IntraDay
- VectorVest AutoTester
- VectorVest Educational Services
- VectorVest OnLine
- VectorVest Options Analyzer
- VectorVest ProGraphics v6.0
- VectorVest ProTrader 7
- VectorVest RealTime Derby Tool
- VectorVest Simulator
- VectorVest Variator
- VectorVest Watchdog
