HOT TOPICS LIST
- MACD
- Fibonacci
- RSI
- Gann
- ADXR
- Stochastics
- Volume
- Triangles
- Futures
- Cycles
- Volatility
- ZIGZAG
- MESA
- Retracement
- Aroon
INDICATORS LIST
LIST OF TOPICS
PRINT THIS ARTICLE
by David Penn
Do divergences mean that the bond market's long nightmare has finally ended?
Position: N/A
David Penn
Technical Writer for Technical Analysis of STOCKS & COMMODITIES magazine, Working-Money.com, and Traders.com Advantage.
PRINT THIS ARTICLE
REVERSAL
A Bottom And A Bounce In Bonds
06/07/06 10:57:34 AMby David Penn
Do divergences mean that the bond market's long nightmare has finally ended?
Position: N/A
| There have been a few articles published here in Traders.com Advantage that speculated on the possibility of bonds moving higher. I addressed the Big Picture in bonds back in an article for Working-Money.com ("Paper Money And Its Promises," April 11, 2006). Among the arguments in that piece was the notion that the bond market, which had enjoyed a secular bull market for many years, was likely to endure a secular bear market of falling prices and rising rates going forward. |

|
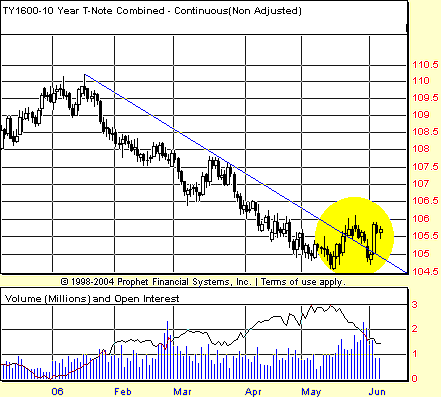
| FIGURE 1: 10-YEAR TREASURY NOTE, CONTINUOUS FUTURES, DAILY. The May break above the multimonth downtrend line was a first signal that the trend may be ripe for reversal. The second was the inability of the bears to push the 10-year T-note to new lows. |
| Graphic provided by: Prophet Financial, Inc. |
| |
| This, of course, does not mean that there won't be instances in which bonds move higher. Secular markets contain cyclical trends that move both pro- and contra- the trend of the secular market. In the same way that the secular bear market in stocks beginning in 2000 has contained a cyclical bull market in stocks beginning in late 2002–early 2003, so should we expect a secular bear market in bonds to occasionally send bond prices higher as contratrend cyclicality asserts itself. |
| It appears that bond watchers, traders, and investors may be on the precipice of just such an occasion in the early summer of 2006. Not only have a number of significant short- and intermediate-term cycles come together (visit Tim Wood at cyclesman.com for valuable information on markets and cycles), but also a number of technical distinctions have developed that suggest that the upside for bonds is more likely to be realized now than at any time in the recent past. |

|
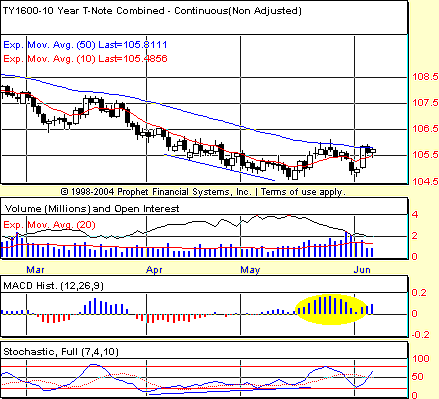
| FIGURE 2: 10-YEAR TREASURY NOTE, CONTINUOUS FUTURES, DAILY. Beginning in April, a running positive stochastic divergence anticipates a bottom in mid-May. The size of the MACD histogram bounce shortlty after that bottom provides further evidence that the next move in the 10-year note is likely higher. |
| Graphic provided by: Prophet Financial, Inc. |
| |
| One of the technical distinctions I am referring to can be seen in Figure 1. The 10-year note has been in a downtrend since mid-January. With a properly drawn trendline (in this case, from the highest high to the lowest high immediately preceding the lowest low), we can see how in May, the 10-year note broke out above the trendline, then reversed in an effort to reassert the downtrend. As of this writing, that attempt has failed, as the lows in June were higher than the lows recorded in May. The next step in this reversal process is for the bulls to try and push the 10-year above what I call the post-break high just north of 106 (basis continuous futures). |
| More bullish technicals for the 10-year are on display in Figure 2. Here, we see a running positive stochastic divergence with origins in April tracking the decline in the 10-year note until mid-May. Higher lows in the stochastic accompanied by lower lows in price are the definition of a positive stochastic divergence, and while divergences do not guarantee reversals, they can be powerful warnings that the current trend is vulnerable. These warnings are all the more potent when they appear with other technicals that present a compatible outlook. Finally, I want to mention the size of the moving average convergence/divergence (MACD) histogram during the initial bounce in the second half of May. When these kind of MACD extremes appear—especially after a long market move—they often signal that the next significant move will be in the direction of the MACD extreme (see my Working-Money.com article, "Post-Breakdown MACD Extremes," May 11, 2004, for more on this phenomenon). In the case of the chart of the 10-year note in Figure 2, the positive MACD histogram peak in the second half of May—a peak that is higher than any since the downtrend began in January—adds further weight to the argument that bonds prices will rise in the short term. |
Technical Writer for Technical Analysis of STOCKS & COMMODITIES magazine, Working-Money.com, and Traders.com Advantage.
| Title: | Technical Writer |
| Company: | Technical Analysis, Inc. |
| Address: | 4757 California Avenue SW |
| Seattle, WA 98116 | |
| Phone # for sales: | 206 938 0570 |
| Fax: | 206 938 1307 |
| Website: | www.Traders.com |
| E-mail address: | DPenn@traders.com |
Traders' Resource Links | |
| Charting the Stock Market: The Wyckoff Method -- Books | |
| Working-Money.com -- Online Trading Services | |
| Traders.com Advantage -- Online Trading Services | |
| Technical Analysis of Stocks & Commodities -- Publications and Newsletters | |
| Working Money, at Working-Money.com -- Publications and Newsletters | |
| Traders.com Advantage -- Publications and Newsletters | |
| Professional Traders Starter Kit -- Software | |
Click here for more information about our publications!
Comments
Date: 06/07/06Rank: 3Comment:

Request Information From Our Sponsors
- StockCharts.com, Inc.
- Candle Patterns
- Candlestick Charting Explained
- Intermarket Technical Analysis
- John Murphy on Chart Analysis
- John Murphy's Chart Pattern Recognition
- John Murphy's Market Message
- MurphyExplainsMarketAnalysis-Intermarket Analysis
- MurphyExplainsMarketAnalysis-Visual Analysis
- StockCharts.com
- Technical Analysis of the Financial Markets
- The Visual Investor
- VectorVest, Inc.
- Executive Premier Workshop
- One-Day Options Course
- OptionsPro
- Retirement Income Workshop
- Sure-Fire Trading Systems (VectorVest, Inc.)
- Trading as a Business Workshop
- VectorVest 7 EOD
- VectorVest 7 RealTime/IntraDay
- VectorVest AutoTester
- VectorVest Educational Services
- VectorVest OnLine
- VectorVest Options Analyzer
- VectorVest ProGraphics v6.0
- VectorVest ProTrader 7
- VectorVest RealTime Derby Tool
- VectorVest Simulator
- VectorVest Variator
- VectorVest Watchdog
