

HOT TOPICS LIST
- MACD
- Fibonacci
- RSI
- Gann
- ADXR
- Stochastics
- Volume
- Triangles
- Futures
- Cycles
- Volatility
- ZIGZAG
- MESA
- Retracement
- Aroon
INDICATORS LIST
LIST OF TOPICS
PRINT THIS ARTICLE
by David Penn
A longed-for bounce in the Dow's descent turns into a pattern anticipating further declines.
Position: N/A
David Penn
Technical Writer for Technical Analysis of STOCKS & COMMODITIES magazine, Working-Money.com, and Traders.com Advantage.
PRINT THIS ARTICLE
FLAGS AND PENNANTS
Bear Flag Suggests Downside Destination
06/06/06 03:42:55 PMby David Penn
A longed-for bounce in the Dow's descent turns into a pattern anticipating further declines.
Position: N/A
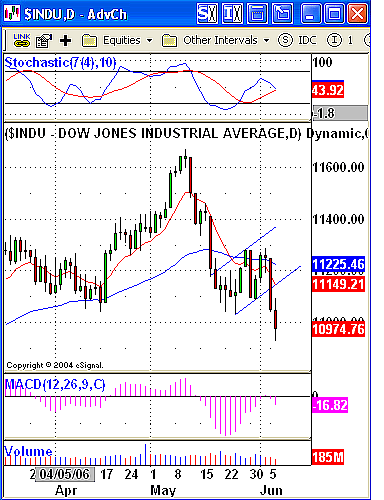
| Hopes that the mid-May lows would represent the bottom of the sharp correction that began at the beginning of the month were not exactly the "worst-founded" of dreams. As Figure 1 shows, trading sessions late in May were characterized by an inability to close at the lows. This, in and of itself, is often a sign that selling pressure is waning and that buyers have been able to gain control of the market when it is most important: at the close. |
|
| FIGURE 1: DOW JONES INDUSTRIAL AVERAGE, DAILY. What started as a bounce in late May appears to have become a bear flag with another 600 points of downside the likely consequence. |
| Graphic provided by: eSignal. |
| |
| That, as they say, was then. It appears in the sessions since that the Dow Jones Industrial Average (DJIA), rather than preparing for a bounce and possible test of the May highs, was simply wedging higher in a manner characteristic of sharp declines. Money manager and host of Investor's Edge, Gary Kaltbaum (garyk.com), was among those who warned that the "wedging higher" pattern in the DJIA and elsewhere was the harbinger not of a move higher, but of a resumption of the correction that began shortly after the DJIA crossed the 11600 mark. |
| For my money, this particular "wedging higher" is tantalizingly close to a bear flag pattern. Bear flag patterns appear in downtrends, usually sharp ones, as a market that moves a little too quickly pauses—allowing both smart and dumb money to ponder and reposition—before continuing on with the prevailing trend. As such, then, bear flags (like bull flags) are continuation patterns when they occur, and traders and speculators should be wary of the potential for a bounce when such patterns appear. |
|
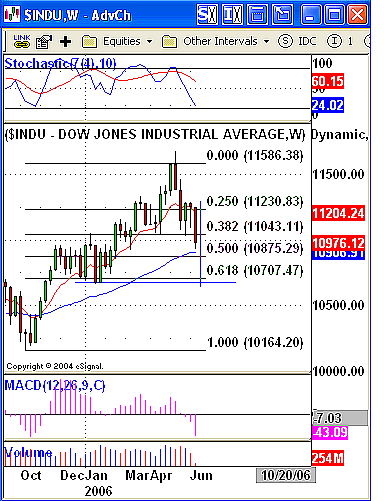
| FIGURE 2: DOW JONES INDUSTRIAL AVERAGE, WEEKLY. The downside projection from the bear flag breaches both a 61.8% Fibonacci retracement of the bull market since October 2005 as well as year-to-date lows in the DJIA. |
| Graphic provided by: eSignal. |
| |
| What in the way of downside does this bear flag anticipate? The measurement rule for flags is to measure the move from the beginning to the bottom of the flag, and then to take that amount and subtract it from the value at the top of the flag. In this case, that means subtracting approximately 610 points from a formation high of 11286 for a minimum downside target of 10576. |
| Such a decline would send the Dow 30 below the 61.8% retracement level as shown in Figure 2. A drop to 10576 would also mark a new yearly low. In addition, there is talk of a head & shoulders top in the DJIA. Whether or not a breakdown from a head & shoulders top has developed, the formation being discussed suggests a downside that is lower than the one projected from the bear flag. |
Technical Writer for Technical Analysis of STOCKS & COMMODITIES magazine, Working-Money.com, and Traders.com Advantage.
| Title: | Technical Writer |
| Company: | Technical Analysis, Inc. |
| Address: | 4757 California Avenue SW |
| Seattle, WA 98116 | |
| Phone # for sales: | 206 938 0570 |
| Fax: | 206 938 1307 |
| Website: | www.Traders.com |
| E-mail address: | DPenn@traders.com |
Traders' Resource Links | |
| Charting the Stock Market: The Wyckoff Method -- Books | |
| Working-Money.com -- Online Trading Services | |
| Traders.com Advantage -- Online Trading Services | |
| Technical Analysis of Stocks & Commodities -- Publications and Newsletters | |
| Working Money, at Working-Money.com -- Publications and Newsletters | |
| Traders.com Advantage -- Publications and Newsletters | |
| Professional Traders Starter Kit -- Software | |
Click here for more information about our publications!
Comments
Date:�06/06/06Rank:�4Comment:�
Date:�06/07/06Rank:�5Comment:�

Request Information From Our Sponsors
- StockCharts.com, Inc.
- Candle Patterns
- Candlestick Charting Explained
- Intermarket Technical Analysis
- John Murphy on Chart Analysis
- John Murphy's Chart Pattern Recognition
- John Murphy's Market Message
- MurphyExplainsMarketAnalysis-Intermarket Analysis
- MurphyExplainsMarketAnalysis-Visual Analysis
- StockCharts.com
- Technical Analysis of the Financial Markets
- The Visual Investor
- VectorVest, Inc.
- Executive Premier Workshop
- One-Day Options Course
- OptionsPro
- Retirement Income Workshop
- Sure-Fire Trading Systems (VectorVest, Inc.)
- Trading as a Business Workshop
- VectorVest 7 EOD
- VectorVest 7 RealTime/IntraDay
- VectorVest AutoTester
- VectorVest Educational Services
- VectorVest OnLine
- VectorVest Options Analyzer
- VectorVest ProGraphics v6.0
- VectorVest ProTrader 7
- VectorVest RealTime Derby Tool
- VectorVest Simulator
- VectorVest Variator
- VectorVest Watchdog