HOT TOPICS LIST
- MACD
- Fibonacci
- RSI
- Gann
- ADXR
- Stochastics
- Volume
- Triangles
- Futures
- Cycles
- Volatility
- ZIGZAG
- MESA
- Retracement
- Aroon
INDICATORS LIST
LIST OF TOPICS
PRINT THIS ARTICLE
by Gary Grosschadl
News that cases of human-to-human transmission of the deadly avian flu may have been discovered sent biotechnology stocks, including Novavax, higher.
Position: Hold
Gary Grosschadl
Independent Canadian equities trader and technical analyst based in Peterborough
Ontario, Canada.
PRINT THIS ARTICLE
FIBONACCI
Novavax Rallies On Bird Flu Scare
06/06/06 12:50:36 PMby Gary Grosschadl
News that cases of human-to-human transmission of the deadly avian flu may have been discovered sent biotechnology stocks, including Novavax, higher.
Position: Hold
| News of possible human-to-human transmission of the avian flu in Indonesia sent biotechnology stocks higher. Malvern, PA–based biotech company Novavax is testing an experimental bird flu vaccine, and also announced recently that it is being added to the NASDAQ Biotechnology Index. What does the chart say (Figure 1)? |
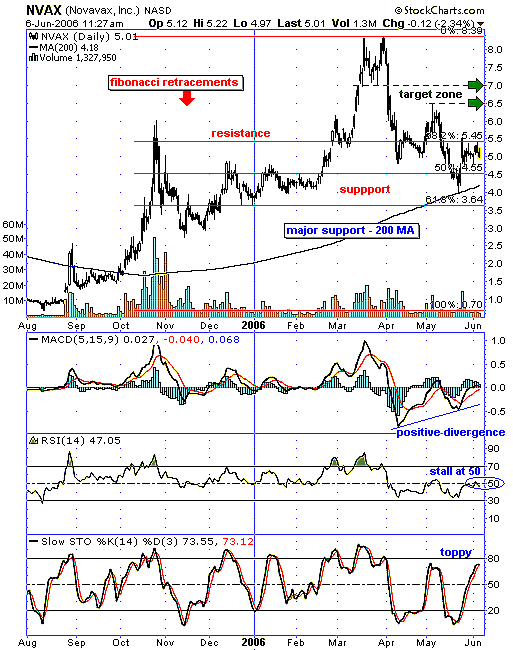
| As a technician, I prefer studying the chart pattern over the news of the day that the market pundits clamor over. I do admit the power of attention-grabbing headlines, though; it reminds me of a common trading weakness called emotional trading. Figure 1 indicates that the stock is bouncing off major support. That support is the oft-watched 200-day moving average (MA), and the stock did a perfect bounce off that level. |

|
| FIGURE 1: NOVAVAX, DAILY. Novavax bounced off major support. |
| Graphic provided by: StockCharts.com. |
| |
| Fibonacci retracement levels are plotted on this chart as a guide to possible support and resistance levels. The high and low determine where the most common retracements can be found, roughly relating to one-third, one-half, and two-thirds. Having fallen through the 50% level and then recovered above it, this 4.55 area can act as support. Should this fail, then the next support would be the 200-day MA or the 61.8% Fibonacci level at 3.64. Current resistance is suggested by the 38.2% level of $5.45. |
| Should the stock beat this overhead resistance level of 5.45, then a target zone is suggested between 6.50 and 7, relating to previous resistance and support. |
| Several indicators are examined. The moving average convergence/divergence (MACD) shows a positive divergence that set up the bounce off the 200-day MA. Now, this graph shows a possible stall at the zero line. Likewise, the relative strength index (RSI) reflects this stall level at its 50 level. This also relates to the stochastics oscillator getting toppy near the 80 level. Traders may have to wait for the next stochastic upleg from lower levels before that resistance at 5.45 is tackled. |
Independent Canadian equities trader and technical analyst based in Peterborough
Ontario, Canada.
| Website: | www.whatsonsale.ca/financial.html |
| E-mail address: | gwg7@sympatico.ca |
Click here for more information about our publications!
Comments
Date: 06/07/06Rank: 5Comment:

Request Information From Our Sponsors
- StockCharts.com, Inc.
- Candle Patterns
- Candlestick Charting Explained
- Intermarket Technical Analysis
- John Murphy on Chart Analysis
- John Murphy's Chart Pattern Recognition
- John Murphy's Market Message
- MurphyExplainsMarketAnalysis-Intermarket Analysis
- MurphyExplainsMarketAnalysis-Visual Analysis
- StockCharts.com
- Technical Analysis of the Financial Markets
- The Visual Investor
- VectorVest, Inc.
- Executive Premier Workshop
- One-Day Options Course
- OptionsPro
- Retirement Income Workshop
- Sure-Fire Trading Systems (VectorVest, Inc.)
- Trading as a Business Workshop
- VectorVest 7 EOD
- VectorVest 7 RealTime/IntraDay
- VectorVest AutoTester
- VectorVest Educational Services
- VectorVest OnLine
- VectorVest Options Analyzer
- VectorVest ProGraphics v6.0
- VectorVest ProTrader 7
- VectorVest RealTime Derby Tool
- VectorVest Simulator
- VectorVest Variator
- VectorVest Watchdog
