HOT TOPICS LIST
- MACD
- Fibonacci
- RSI
- Gann
- ADXR
- Stochastics
- Volume
- Triangles
- Futures
- Cycles
- Volatility
- ZIGZAG
- MESA
- Retracement
- Aroon
INDICATORS LIST
LIST OF TOPICS
PRINT THIS ARTICLE
by Luis Ferro
The long-term rally for Carnival Corp. ended with a triple-top pattern and subsequent breakdown, changing the direction of the long-term trend. In the short term, the stock has formed a pennant pattern that forecasts lower prices for CCL.
Position: Sell
Luis Ferro
Trader and technical analyst living in Bern, Switzerland. A full member of the STA, currently enrolled in the DITA program and the CMT program.
PRINT THIS ARTICLE
CANDLESTICK CHARTING
Pennant For Carnival Corp.
06/06/06 10:18:50 AMby Luis Ferro
The long-term rally for Carnival Corp. ended with a triple-top pattern and subsequent breakdown, changing the direction of the long-term trend. In the short term, the stock has formed a pennant pattern that forecasts lower prices for CCL.
Position: Sell
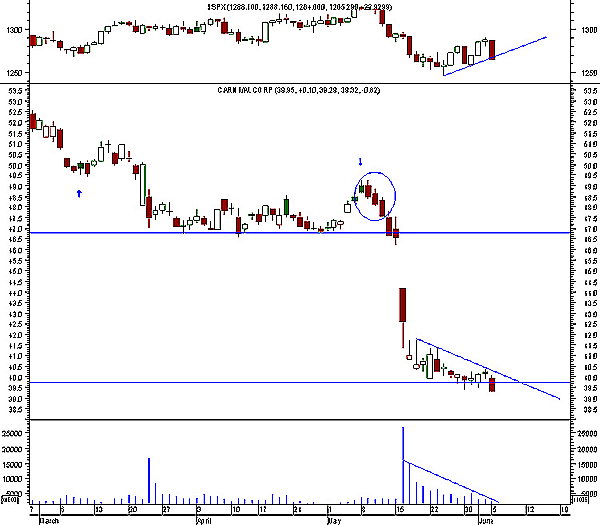
| The daily candlestick chart of Carnival Corp. (CCL) allows a detailed analysis of the short-term trend. See Figure 1. |

|
| FIGURE 1: CARNIVAL CORP., DAILY. This chart of CCL shows a detailed analysis of the short-term trend. |
| Graphic provided by: MetaStock. |
| |
| After falling to a low of 47 in March, CCL entered a trading range that lasted for almost two months. The stock tried to break above this congestion area, but an old level of support at 49.5 turned into resistance (marked with a blue arrow in Figure 1). At this point, a bearish candlestick pattern known as the "three black crows" started to form, which was the first indication that prices would probably break below the congestion. This reversal pattern is formed by a sequence of three consecutive black candlesticks (marked by a circle) and is considered strongly bearish. CCL finally broke below the 46.5 level with a strong breakaway gap. It is not easy to interpret gaps in real time, but since there was strong volume on the day of the gap and since the stock also broke away from a congestion, chances were in favor of a breakaway gap. Following the gap, the stock continued to fall until it reached the 39.5–40 level, and at that point, a pennant started to form. |
| Pennants are short-term triangular formations that usually occur after a strong directional move. They are continuation patterns, so in this case the pennant has bearish implications. Volume is clearly declining along the pennant, a fact that increases the chances that the prices will indeed continue in the same direction of the move that precedes the pattern. On the last trading day, CCL finally closed below the lower level of the formation, therefore completing the pattern. Figure 1 also shows the Standard & Poor's 500. It is pretty clear that even though the S&P 500 is rising in the short term, CCL continues to decline along the congestion. This is a major sign of weakness and an indication that prices will continue to fall now that the pennant has been completed. |

|
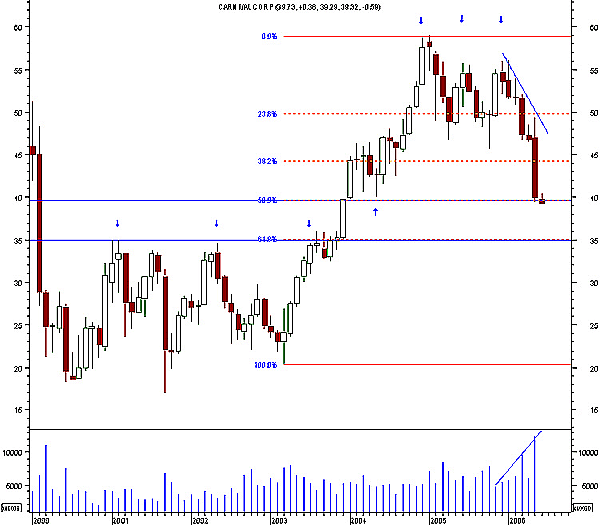
| FIGURE 2: CARNIVAL CORP., MONTHLY. The long rally that started in 2003 ended with the formation of a long-term triple top. |
| Graphic provided by: MetaStock. |
| |
| In the monthly chart of Carnival Corp. (Figure 2), it can be seen that the long rally that started in 2003 ended with the formation of a long-term triple top (the tops are marked with three blue arrows), and that the long-term trend is currently down and volume is increasing. The level at which the pennant occurred previously acted as support and also coincides with the 50% Fibonacci retracement level (shown in orange). When several different types of support/resistance combine at a certain level, the chances that this level will be effective in stopping the prices increase substantially. When entering a trade, it is always important to try to define price targets in order to quantify the possible reward. The level of 35 has been a very important resistance level in the past (as shown by the blue arrows in Figure 2), and this level also coincides with the 61.8% Fibonacci retracement. This is the most likely target for CCL, now that prices have broken below the pennant. |
Trader and technical analyst living in Bern, Switzerland. A full member of the STA, currently enrolled in the DITA program and the CMT program.
| Address: | Switzerland |
| E-mail address: | luispgsf@yahoo.com |
Click here for more information about our publications!
Comments
Date: 06/06/06Rank: 3Comment:

Request Information From Our Sponsors
- StockCharts.com, Inc.
- Candle Patterns
- Candlestick Charting Explained
- Intermarket Technical Analysis
- John Murphy on Chart Analysis
- John Murphy's Chart Pattern Recognition
- John Murphy's Market Message
- MurphyExplainsMarketAnalysis-Intermarket Analysis
- MurphyExplainsMarketAnalysis-Visual Analysis
- StockCharts.com
- Technical Analysis of the Financial Markets
- The Visual Investor
- VectorVest, Inc.
- Executive Premier Workshop
- One-Day Options Course
- OptionsPro
- Retirement Income Workshop
- Sure-Fire Trading Systems (VectorVest, Inc.)
- Trading as a Business Workshop
- VectorVest 7 EOD
- VectorVest 7 RealTime/IntraDay
- VectorVest AutoTester
- VectorVest Educational Services
- VectorVest OnLine
- VectorVest Options Analyzer
- VectorVest ProGraphics v6.0
- VectorVest ProTrader 7
- VectorVest RealTime Derby Tool
- VectorVest Simulator
- VectorVest Variator
- VectorVest Watchdog
