HOT TOPICS LIST
- MACD
- Fibonacci
- RSI
- Gann
- ADXR
- Stochastics
- Volume
- Triangles
- Futures
- Cycles
- Volatility
- ZIGZAG
- MESA
- Retracement
- Aroon
INDICATORS LIST
LIST OF TOPICS
PRINT THIS ARTICLE
by David Penn
It's summertime. Do positive divergences in the stochastic and moving average convergence/divergence histogram mean that cotton will be high this year?
Position: N/A
David Penn
Technical Writer for Technical Analysis of STOCKS & COMMODITIES magazine, Working-Money.com, and Traders.com Advantage.
PRINT THIS ARTICLE
REVERSAL
Divergences In Cotton
06/02/06 09:31:50 AMby David Penn
It's summertime. Do positive divergences in the stochastic and moving average convergence/divergence histogram mean that cotton will be high this year?
Position: N/A
| In a recent article, I looked at the long- and intermediate-term picture for cotton in an article for Traders.com Advantage ("Cotton's Come Up(pance)," June 2, 2006). In the article, I suggested a number of things: (a) that cotton was in a secular bull market from the mid-1960s until 1995; (b) that cotton remains in the secular bear market that began approximately 10 years ago; and (c) that cotton's secular bear market will be confirmed if the lows of late 2004—at roughly 42 cents—are taken out to the downside. |

|
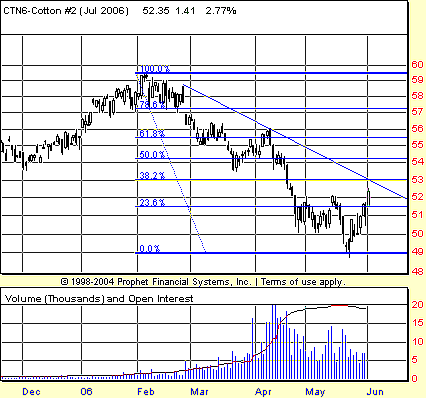
| FIGURE 1: JULY COTTON FUTURES, DAILY. The short-term bounce in cotton futures sends the market on a likely collision course with both the 38.2% Fibonacci retracement level and a major downtrend line from the February highs. |
| Graphic provided by: Prophet Financial, Inc. |
| |
| The price action shown in Figure 1 represents the cotton market's break below a trendline that extends from the lows of late 2004 mentioned previously. The specific break occurred at approximately 54 cents. Figure 1 also points out the degree to which cotton has begun to retrace some of its decline from the 59-cent area. Putting in a low in late May, July cotton has managed to retrace more than 25% but still not yet a Fibonacci 38.2% level. Interestingly, the 38.2% Fibonacci retracement level coincides almost perfectly with the downtrend line from the highs near the beginning of the year. |
| Cotton has yet to put in a higher low, so for all intents and purposes, the market remains bearish on the short term. Given the consolidation between 52 and 49 cents from latest April to latest May, a trader looking to buy cotton could use Stan Weinstein's swing rule to project a rally to the 55-cent area (width of consolidation added to value at top of consolidation). And I suspect it is no coincidence that the 55-cent area is only about half a cent away from another Fibonacci retracement level, the 61.8% retracement. |

|
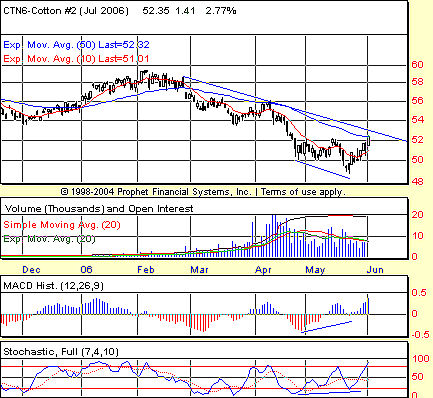
| FIGURE 2: JULY COTTON FUTURES, DAILY. Positive divergences in both the stochastic and the MACD histogram anticipated the bounce in July cotton—and the test of the downtrend line from early in the year. |
| Graphic provided by: Prophet Financial, Inc. |
| |
| Additional evidence in support of a move higher in the near term comes in the form of a pair of mutually confirming positive divergences in the stochastics and in the MACD histogram. These divergences are ideally spaced, their higher lows from late April to late May matching the lower lows in price over the same period. In fact, CTN6 has already confirmed the positive divergences by rallying to a closing high above the high of the initial low (late April)—essentially, a breakout above 52. |
| There is plenty of resistance for July cotton to deal with. As Figure 2 shows, there is a 50-day exponential moving average (in blue), and the trendline from the February highs. Both of these potential resistance levels only add to the potential for resistance at the 38.2% Fibonacci retracement level. |
Technical Writer for Technical Analysis of STOCKS & COMMODITIES magazine, Working-Money.com, and Traders.com Advantage.
| Title: | Technical Writer |
| Company: | Technical Analysis, Inc. |
| Address: | 4757 California Avenue SW |
| Seattle, WA 98116 | |
| Phone # for sales: | 206 938 0570 |
| Fax: | 206 938 1307 |
| Website: | www.Traders.com |
| E-mail address: | DPenn@traders.com |
Traders' Resource Links | |
| Charting the Stock Market: The Wyckoff Method -- Books | |
| Working-Money.com -- Online Trading Services | |
| Traders.com Advantage -- Online Trading Services | |
| Technical Analysis of Stocks & Commodities -- Publications and Newsletters | |
| Working Money, at Working-Money.com -- Publications and Newsletters | |
| Traders.com Advantage -- Publications and Newsletters | |
| Professional Traders Starter Kit -- Software | |
Click here for more information about our publications!
Comments
Date: 06/02/06Rank: 3Comment:
Date: 06/06/06Rank: 5Comment:
Date: 06/13/06Rank: 5Comment:

Request Information From Our Sponsors
- StockCharts.com, Inc.
- Candle Patterns
- Candlestick Charting Explained
- Intermarket Technical Analysis
- John Murphy on Chart Analysis
- John Murphy's Chart Pattern Recognition
- John Murphy's Market Message
- MurphyExplainsMarketAnalysis-Intermarket Analysis
- MurphyExplainsMarketAnalysis-Visual Analysis
- StockCharts.com
- Technical Analysis of the Financial Markets
- The Visual Investor
- VectorVest, Inc.
- Executive Premier Workshop
- One-Day Options Course
- OptionsPro
- Retirement Income Workshop
- Sure-Fire Trading Systems (VectorVest, Inc.)
- Trading as a Business Workshop
- VectorVest 7 EOD
- VectorVest 7 RealTime/IntraDay
- VectorVest AutoTester
- VectorVest Educational Services
- VectorVest OnLine
- VectorVest Options Analyzer
- VectorVest ProGraphics v6.0
- VectorVest ProTrader 7
- VectorVest RealTime Derby Tool
- VectorVest Simulator
- VectorVest Variator
- VectorVest Watchdog
