HOT TOPICS LIST
- MACD
- Fibonacci
- RSI
- Gann
- ADXR
- Stochastics
- Volume
- Triangles
- Futures
- Cycles
- Volatility
- ZIGZAG
- MESA
- Retracement
- Aroon
INDICATORS LIST
LIST OF TOPICS
PRINT THIS ARTICLE
by Paolo Pezzutti
This formation is common when assets consolidate before resuming the original trend.
Position: N/A
Paolo Pezzutti
Author of the book "Trading the US Markets - A Comprehensive Guide to US Markets for International Traders and Investors" - Harriman House (July 2008)
PRINT THIS ARTICLE
SYMMETRICAL TRIANGLE
Continuation Pattern: Symmetrical Triangle
06/02/06 09:18:49 AMby Paolo Pezzutti
This formation is common when assets consolidate before resuming the original trend.
Position: N/A
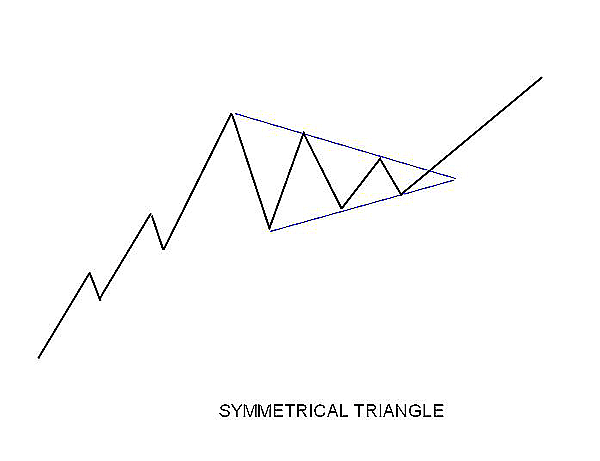
| The symmetrical triangle is usually a continuation pattern. It represents a pause in the existing trend after which the original trend is resumed. The minimum requirement for a triangle is four reversal points. In this way, each of the two converging trendlines that contain prices has to be touched at least twice. The two trendlines meet at the apex. Normally, prices should break out in the direction of the original trend between two-thirds and three-quarters of the triangle's width. The longer prices remain within the triangle beyond these limits, the weaker the following move might be. Therefore, this formation provides an interesting combination of price and time. After the breakout, prices can pull back toward the apex. Volume should diminish as the formation progresses, but it should be heavy when prices breakout the trendline. To measure the objective of the move is quite simple. Normally, you can consider the height of the widest part of the triangle (the initial part) and project it from the breakout point in the direction of the breakout. As an alternative, you can draw a parallel to the trendline opposite to the one of the breakout. So if, for example, you have a breakout to the upside, you have to draw a parallel of the lower trendline. |

|
| FIGURE 1: SYMMETRICAL TRIANGLE = CONTINUATION PATTERN. This pattern represents a pause before the original trend is resumed. |
| Graphic provided by: powerpoint. |
| |
Markets spend long periods of time developing congestions and trading ranges. They alternate trend and congestions, and the move to new areas of balance is usually fast. To enter a short-term trade, swing traders try to exploit a low-risk entry and capitalize on an expansion breakout. Triangles allow this type of approach. The beginning of their formation is characterized by high volatility. As they develop, volume dries up and volatility gets low. You will not spot a triangle formation early. However, as they develop, traders can recognize it easily. The common understanding about triangles is that ascending triangles are bullish, while descending triangles form the most bearish ones. Symmetrical triangles suggest a continuation pattern. You can follow different approaches when trading symmetrical triangles (Figure 1). For example, you can:- Trade the breakout of the trendline |

|
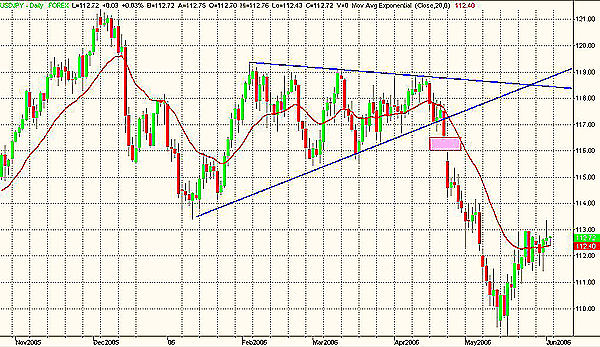
| FIGURE 2: FOREX USD/JPY. The formation developed from the beginning of 2006. The breakout without a pullback brought prices to the objective quickly. |
| Graphic provided by: TradeStation. |
| |
| In Figure 2, you can see that the USD/JPY developed a triangle before increasing its volatility developing a fast selloff. The breakout was not followed by a pullback. Prices accelerated to the downside. An important gap was also printed. |

|
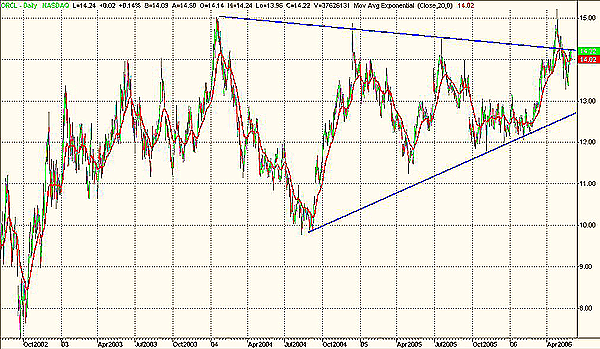
| FIGURE 3: ORCL. A long triangle has been developing. |
| Graphic provided by: TradeStation. |
| |
| In Figure 3, you can see that Oracle (ORCL) has been developing a long triangle formation. The original trend, however, was not very directional. In this case, the stock has printed a breakout to the upside, but following that, prices have returned below the upper trendline. Sometimes it is not so easy. |

|
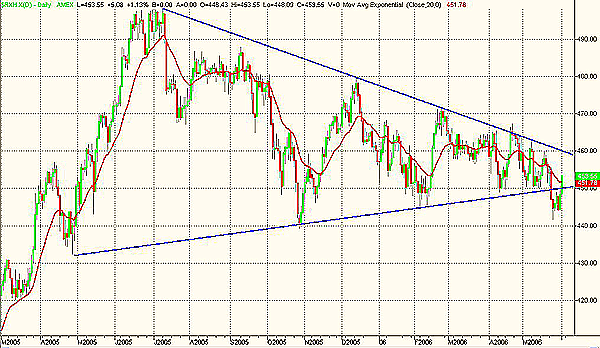
| FIGURE 4: $RHX. Prices have almost reached the apex of the formation. They have attempted a breakout to the downside. |
| Graphic provided by: TradeStation. |
| |
| In Figure 4, the AMEX MS Health Care Prov ($RXH) has been developing a symmetrical triangle at the end of long uptrend. The triangle has been developed since last year. This looks like a perfect consolidation move before resuming the uptrend. Now, prices are testing the lower trendline. In the daily time frame, they have attempted a breakout to the downside, returning immediately within the triangle. Although I believe this is a bullish formation, real trading presents different situations every time, applying risk management with discipline. |
Author of the book "Trading the US Markets - A Comprehensive Guide to US Markets for International Traders and Investors" - Harriman House (July 2008)
| Address: | VIA ROBERTO AGO 26 POSTAL CODE 00166 |
| Rome, ITALY | |
| Phone # for sales: | +393357540708 |
| E-mail address: | pezzutti.paolo@tiscali.it |
Click here for more information about our publications!
Comments
Date: 06/02/06Rank: 4Comment:
Date: 06/02/06Rank: 4Comment:

Request Information From Our Sponsors
- VectorVest, Inc.
- Executive Premier Workshop
- One-Day Options Course
- OptionsPro
- Retirement Income Workshop
- Sure-Fire Trading Systems (VectorVest, Inc.)
- Trading as a Business Workshop
- VectorVest 7 EOD
- VectorVest 7 RealTime/IntraDay
- VectorVest AutoTester
- VectorVest Educational Services
- VectorVest OnLine
- VectorVest Options Analyzer
- VectorVest ProGraphics v6.0
- VectorVest ProTrader 7
- VectorVest RealTime Derby Tool
- VectorVest Simulator
- VectorVest Variator
- VectorVest Watchdog
- StockCharts.com, Inc.
- Candle Patterns
- Candlestick Charting Explained
- Intermarket Technical Analysis
- John Murphy on Chart Analysis
- John Murphy's Chart Pattern Recognition
- John Murphy's Market Message
- MurphyExplainsMarketAnalysis-Intermarket Analysis
- MurphyExplainsMarketAnalysis-Visual Analysis
- StockCharts.com
- Technical Analysis of the Financial Markets
- The Visual Investor
