HOT TOPICS LIST
- MACD
- Fibonacci
- RSI
- Gann
- ADXR
- Stochastics
- Volume
- Triangles
- Futures
- Cycles
- Volatility
- ZIGZAG
- MESA
- Retracement
- Aroon
INDICATORS LIST
LIST OF TOPICS
PRINT THIS ARTICLE
by David Penn
Assuming the market doesn't crash in the last week of May and first week of June, the NYSE is setting up for an ideal test of the recent lows.
Position: N/A
David Penn
Technical Writer for Technical Analysis of STOCKS & COMMODITIES magazine, Working-Money.com, and Traders.com Advantage.
PRINT THIS ARTICLE
MACD
Retesting The Lows
05/31/06 09:39:31 AMby David Penn
Assuming the market doesn't crash in the last week of May and first week of June, the NYSE is setting up for an ideal test of the recent lows.
Position: N/A
| What makes a test of the lows? Obviously, it could be when a market makes its lows, bounces, then retreats to come near the lows but stop short before reversing or, conversely, moves to new lows for a session or two before reversing. But how do we know that the market has made its lows? How do we know if a bounce is complete? And with regard to the "near the lows" versus brief "new lows" scenarios: how do we know if the market has stopped short? How do we tell the difference between a brief penetration of the lows and new lows that will lead to further lows? |

|
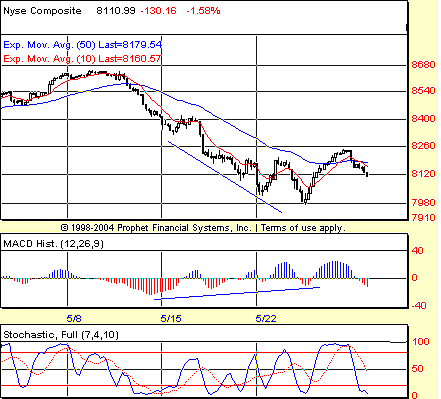
| FIGURE 1: NEW YORK STOCK EXCHANGE COMPOSITE, HOURLY. A multiple or running positive MACD histogram divergence strongly suggests that a significant low was established mid-session on May 24. This divergence is confirmed by a similar positive divergence in the stochastic. |
| Graphic provided by: Prophet Financial, Inc. |
| |
| As I suggested in a recent piece, the positive divergences in both the moving average convergence/divergence (MACD) histogram and stochastics have suggested that there is a waning of downside momentum since mid-May—a time when the selloff seemed to be only getting more intense from a price perspective (Figure 1). This declining downside momentum reached its trough in the lows of May 24. As such, if there is to be a successful retest of the lows (especially of the first, "stop short" variety), then the lows of May 24 should hold. |
| This speaks to both the initial lows and the bounce, particularly over the short term. The selloff on the Tuesday following the Memorial Day weekend brought a great deal of panic and pessimism to the market (as a down 184-point day in the Dow Jones Industrial Average tends to do!). And it appears that this selloff was the market's way of making traders, speculators, and interested observers alike fearful and distrustful of the nascent preholiday bounce. But I suspect that the totality of the bounce has not yet arrived. I find it difficult to believe that a positive divergence that takes eight days to develop will yield only a two-day positive move. Possible, sure, but unlikely, in my opinion. What is more likely is that the late May bounce served to set up a true test of the May lows. There is even a negative stochastic divergence—a short-term one, even in the context of an hourly chart—at the top of the bounce on May 26 that set up what appears to be a test of the May lows over the next few days. |

|
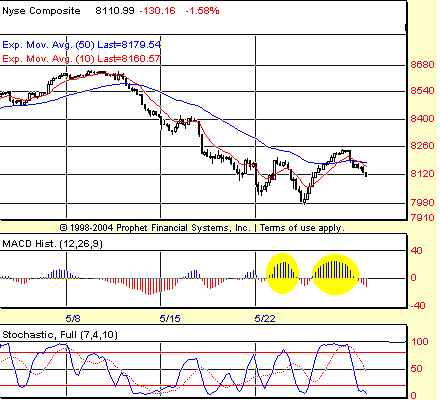
| FIGURE 2: NEW YORK STOCK EXCHANGE COMPOSITE INDEX, HOURLY. The appearance of strongly positive MACD histogram peaks after a significant decline is often a sign that a market's correction has run its course and that the next move of consequence will be higher. |
| Graphic provided by: Prophet Financial, Inc. |
| |
| Another bullish aspect of the current bounce is the pattern that has been created in the MACD histogram (Figure 2). Note how the positive histograms have become significantly larger than the negative histograms in late May as prices tried to trace out a low around the 7980 area. This is another tell that the momentum is building for a move to the upside. In fact, as far as textbook technical analysis goes, the NYSE has already created a higher high on the hourly chart. All that remains ("all"?!) is that the NYSE create a pattern of higher lows. This will be achieved if the NYSE can remain above 7980. |
| In this, the hourly chart of the NYSE is somewhat similar to the weekly chart of US Dollar Index. Both charts (see my Traders.com Advantage article "Dancing Days For The Dollar?" from May 26) reflect markets in which sentiment is abundantly negative—resignedly so in the case of the greenback—in which prices have been nevertheless moderating. In the case of the greenback, there is a weekly head & shoulders bottom pattern that awaits resolution and the opportunity for a surprising move to the upside. The pattern in the hourly NYSE is not nearly as developed (if there is a head & shoulders bottom in the hourly NYSE, then it still lacks a right "shoulder"). But in both instances, the hourly NYSE and the weekly greenback, it increasingly looks as if the bears may have overplayed their hand for the time being. |
Technical Writer for Technical Analysis of STOCKS & COMMODITIES magazine, Working-Money.com, and Traders.com Advantage.
| Title: | Technical Writer |
| Company: | Technical Analysis, Inc. |
| Address: | 4757 California Avenue SW |
| Seattle, WA 98116 | |
| Phone # for sales: | 206 938 0570 |
| Fax: | 206 938 1307 |
| Website: | www.Traders.com |
| E-mail address: | DPenn@traders.com |
Traders' Resource Links | |
| Charting the Stock Market: The Wyckoff Method -- Books | |
| Working-Money.com -- Online Trading Services | |
| Traders.com Advantage -- Online Trading Services | |
| Technical Analysis of Stocks & Commodities -- Publications and Newsletters | |
| Working Money, at Working-Money.com -- Publications and Newsletters | |
| Traders.com Advantage -- Publications and Newsletters | |
| Professional Traders Starter Kit -- Software | |
Click here for more information about our publications!
Comments
Date: 05/31/06Rank: 3Comment:
Date: 06/01/06Rank: 5Comment:
Date: 06/01/06Rank: 5Comment:

Request Information From Our Sponsors
- StockCharts.com, Inc.
- Candle Patterns
- Candlestick Charting Explained
- Intermarket Technical Analysis
- John Murphy on Chart Analysis
- John Murphy's Chart Pattern Recognition
- John Murphy's Market Message
- MurphyExplainsMarketAnalysis-Intermarket Analysis
- MurphyExplainsMarketAnalysis-Visual Analysis
- StockCharts.com
- Technical Analysis of the Financial Markets
- The Visual Investor
- VectorVest, Inc.
- Executive Premier Workshop
- One-Day Options Course
- OptionsPro
- Retirement Income Workshop
- Sure-Fire Trading Systems (VectorVest, Inc.)
- Trading as a Business Workshop
- VectorVest 7 EOD
- VectorVest 7 RealTime/IntraDay
- VectorVest AutoTester
- VectorVest Educational Services
- VectorVest OnLine
- VectorVest Options Analyzer
- VectorVest ProGraphics v6.0
- VectorVest ProTrader 7
- VectorVest RealTime Derby Tool
- VectorVest Simulator
- VectorVest Variator
- VectorVest Watchdog
