HOT TOPICS LIST
- MACD
- Fibonacci
- RSI
- Gann
- ADXR
- Stochastics
- Volume
- Triangles
- Futures
- Cycles
- Volatility
- ZIGZAG
- MESA
- Retracement
- Aroon
INDICATORS LIST
LIST OF TOPICS
PRINT THIS ARTICLE
by David Penn
A cycle swing sets up a short-term low in unhedged gold mining stocks. The 1-2-3 trend reversal helps traders and speculators take advantage of it.
Position: N/A
David Penn
Technical Writer for Technical Analysis of STOCKS & COMMODITIES magazine, Working-Money.com, and Traders.com Advantage.
PRINT THIS ARTICLE
REVERSAL
A 1-2-3 Bounce In Gold
05/31/06 09:16:25 AMby David Penn
A cycle swing sets up a short-term low in unhedged gold mining stocks. The 1-2-3 trend reversal helps traders and speculators take advantage of it.
Position: N/A
| Based in part on the cycles analysis of Tim Wood (cyclesman.com), there is a reasonable expectation that gold and gold stocks will bounce in the late May–early June time frame. This low is not the sort of intermediate low that can be expected in gold later in the summer. By comparison, the low that stocks are trying to make at the current time is both short term and intermediate term (based on both daily and weekly cycles). When cycles or other technical studies suggest that a reversal in trend might be approaching, there can be a benefit in looking to shorter-term time frames in order to get the best entry possible. During a seminar at the Chicago Traders Expo in 2005, a hedge fund manager presenting alongside The Market Vu Show (themarketvushow.com) pointed out how he liked to spot potential trading opportunities in the daily chart, then zoom in to hourly and 15-minute charts in order to minimize risk by relying on intraday support and resistance levels that might otherwise go unnoticed. If we start with the thesis that gold is making a short-term low and bring to that thesis an analysis of intraday trends in gold mining stocks that typically, but not infallibly, lead the price of gold, then we should be able to spot any early opportunity—if any—to pick up gold shares as they swing higher. |

|
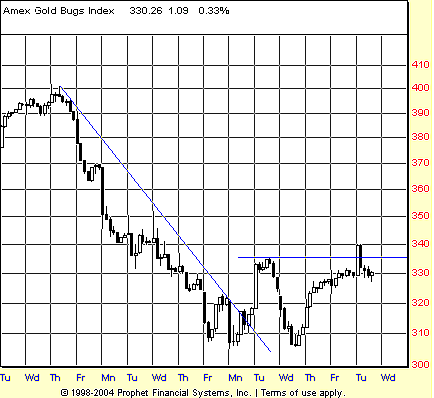
| FIGURE 1: AMEX GOLD BUGS INDEX, HOURLY. A swing rule projection from the recent lows in the $HUI suggests an upside bounce that could test the 370 level over the next few days. |
| Graphic provided by: Prophet Financial, Inc. |
| |
| Here, the 1-2-3 trend reversal approach provides some guidance in terms of analyzing the bottoming process in the AMEX Gold BUGS Index. Recall that the 1-2-3 trend reversal method requires first a properly drawn trendline. For purposes of this method, that trendline is drawn by connecting the highest high in a given time frame with the lowest high that is immediately before the lowest low. The trendline in the chart of the $HUI in Figure 1 is an example of such a trendline. |
| The "1" in the 1-2-3 trend reversal is the initial trendline break. The "2" refers to the effort to reestablish the trend by making a new low (or new high, in the case of a broken uptrend). The "3" stands for the move beyond the resistance (or support, in the case of a broken uptrend) established by the market during step 1 of the 1-2-3 trend reversal. By applying this analysis to the hourly $HUI, we can see that both stages 1 and 2 appear to be complete. The $HUI has broken its downtrend and established a key resistance point (1). The $HUI has fallen back in a failed attempt to set a new low (2). Most recently, the $HUI has been moving higher toward a test of the resistance point established in stage 1. |

|
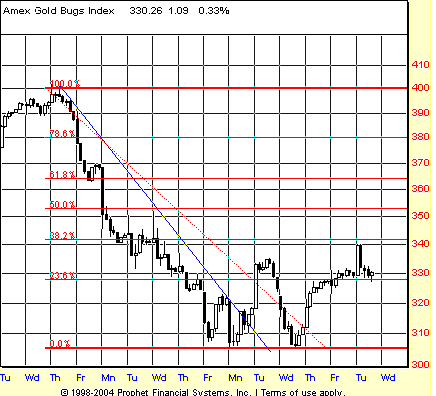
| FIGURE 2: AMEX GOLD BUGS INDEX, HOURLY. Is Tuesday "test resistance day"? Both advances off the lows have so far failed to reach a Fibonacci 38.2% retracement level just north of 340. |
| Graphic provided by: Prophet Financial, Inc. |
| |
| Should the $HUI break through the resistance from stage 1 for a successful stage 3 of the 1-2-3 trend reversal, it would be worthwhile to consider the upside implications of the successful breakout. In this, Stan Weinstein's swing rule is a helpful way of projecting a reasonable upside beyond the resistance level. Taking the measure of the market below the resistance level and adding that amount to the value at resistance gives a potential upside in the 365 region. |
| Now, 365 is an interesting area. As Figure 2 shows, 365 makes a Fibonacci 61.8% retracement level of the $HUI's entire correction from mid-May. Having not reached yet the more modest 38.2% retracement level in any bounce so far, the $HUI might not make it to the 61.8% level in a single bound. But for those inclined to ride any move higher in the gold shares at the present time, 365 looks like a more than reasonable aspiration. |
Technical Writer for Technical Analysis of STOCKS & COMMODITIES magazine, Working-Money.com, and Traders.com Advantage.
| Title: | Technical Writer |
| Company: | Technical Analysis, Inc. |
| Address: | 4757 California Avenue SW |
| Seattle, WA 98116 | |
| Phone # for sales: | 206 938 0570 |
| Fax: | 206 938 1307 |
| Website: | www.Traders.com |
| E-mail address: | DPenn@traders.com |
Traders' Resource Links | |
| Charting the Stock Market: The Wyckoff Method -- Books | |
| Working-Money.com -- Online Trading Services | |
| Traders.com Advantage -- Online Trading Services | |
| Technical Analysis of Stocks & Commodities -- Publications and Newsletters | |
| Working Money, at Working-Money.com -- Publications and Newsletters | |
| Traders.com Advantage -- Publications and Newsletters | |
| Professional Traders Starter Kit -- Software | |
Click here for more information about our publications!
Comments
Date: 05/31/06Rank: 3Comment:
Date: 06/01/06Rank: 5Comment:

Request Information From Our Sponsors
- StockCharts.com, Inc.
- Candle Patterns
- Candlestick Charting Explained
- Intermarket Technical Analysis
- John Murphy on Chart Analysis
- John Murphy's Chart Pattern Recognition
- John Murphy's Market Message
- MurphyExplainsMarketAnalysis-Intermarket Analysis
- MurphyExplainsMarketAnalysis-Visual Analysis
- StockCharts.com
- Technical Analysis of the Financial Markets
- The Visual Investor
- VectorVest, Inc.
- Executive Premier Workshop
- One-Day Options Course
- OptionsPro
- Retirement Income Workshop
- Sure-Fire Trading Systems (VectorVest, Inc.)
- Trading as a Business Workshop
- VectorVest 7 EOD
- VectorVest 7 RealTime/IntraDay
- VectorVest AutoTester
- VectorVest Educational Services
- VectorVest OnLine
- VectorVest Options Analyzer
- VectorVest ProGraphics v6.0
- VectorVest ProTrader 7
- VectorVest RealTime Derby Tool
- VectorVest Simulator
- VectorVest Variator
- VectorVest Watchdog
