HOT TOPICS LIST
- MACD
- Fibonacci
- RSI
- Gann
- ADXR
- Stochastics
- Volume
- Triangles
- Futures
- Cycles
- Volatility
- ZIGZAG
- MESA
- Retracement
- Aroon
INDICATORS LIST
LIST OF TOPICS
PRINT THIS ARTICLE
by Gary Grosschadl
Inco Ltd. is Canada's nickel-producing giant and is on another upswing. Who needs gold with profits like this?
Position: Hold
Gary Grosschadl
Independent Canadian equities trader and technical analyst based in Peterborough
Ontario, Canada.
PRINT THIS ARTICLE
CHART ANALYSIS
Canadian Nickel Miner Inco Making Dollars
05/30/06 11:51:31 AMby Gary Grosschadl
Inco Ltd. is Canada's nickel-producing giant and is on another upswing. Who needs gold with profits like this?
Position: Hold
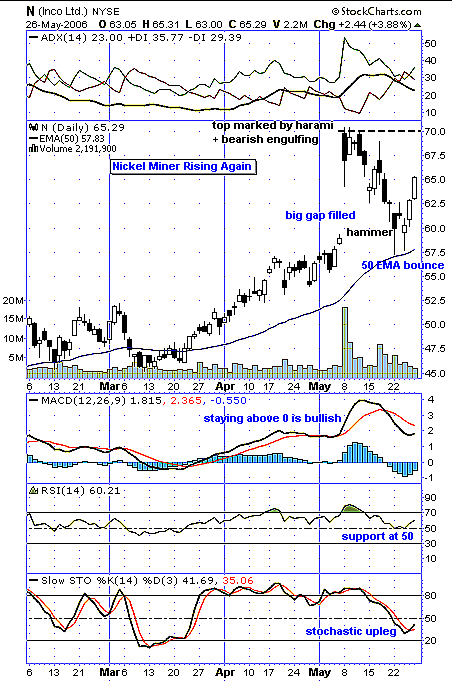
| Traders often talk abouts gaps being filled eventually. This large gap on this daily chart (Figure 1) took less than three weeks to fill. This breakout started innocently enough on unassuming volume, but on the big gap day, volume surged past 50 million shares. No doubt happy sellers did not overstay the party. When volume dried up, there was a lack of fresh buying to continue the rise. Once the gap closed, some traders were enticed to risk entry at much better prices. |
| In this instance, the gap being filled had extra importance as the stock also bounced off previous resistance (the breakout point) and off the 50-day exponential moving average (EMA) (a prominent moving average). For traders trading this bounce on good entry (below $63), the upside trading target is the previous high of around $70. This is not to say it can't go higher but with this obvious trading target, another pause or reversal is likely. |

|
| FIGURE 1: INCO, DAILY. The gap is filled on this chart with added conviction. |
| Graphic provided by: StockCharts.com. |
| |
| Candlestick readers would have done well here. The top was hinted at with no less than four warnings in succession: harami-doji-harami combination, followed by a bearish engulfing. The harami occurs when the follwing candlestick body is contained in the previous candle body, indicating a reluctance to go higher. The doji (small cross) indicates a loss of momentum as bullish and bearish forces are in a tug-of-war. Finally, the bearish engulfing suggests downward action is imminent. With the bounce off the 50-day EMA, we have a hammer candlestick "hammering out" a bottom. The long tail marks the bottom, which is eventually confirmed higher. |
| Several indicators are considered. The directional movement indicator (DMI) at the top of the chart shows three components: The DIs (positive and negative directional indicators) show a bullish cross, but the average directional movement index (ADX) needs to reverse and upslope to show growing trend strength. This often lags quick reversals. The moving average convergence/divergence (MACD) indicator hints at a turn above zero, which would be very bullish. The relative strength index (RSI), being more sensitive to quick turns, shows a timely bounce off the 50-level support, often a key area. Finally, the stochastic oscillator, also more sensitive to quick turns, shows a bullish cross and upswing from a low level. |
| In summary, a healthy bounce is indicated. But whether it will surge past the previous high in this current upswing remains to be seen. |
Independent Canadian equities trader and technical analyst based in Peterborough
Ontario, Canada.
| Website: | www.whatsonsale.ca/financial.html |
| E-mail address: | gwg7@sympatico.ca |
Click here for more information about our publications!
Comments
Date: 05/30/06Rank: 5Comment:
Date: 05/31/06Rank: 4Comment:

Request Information From Our Sponsors
- VectorVest, Inc.
- Executive Premier Workshop
- One-Day Options Course
- OptionsPro
- Retirement Income Workshop
- Sure-Fire Trading Systems (VectorVest, Inc.)
- Trading as a Business Workshop
- VectorVest 7 EOD
- VectorVest 7 RealTime/IntraDay
- VectorVest AutoTester
- VectorVest Educational Services
- VectorVest OnLine
- VectorVest Options Analyzer
- VectorVest ProGraphics v6.0
- VectorVest ProTrader 7
- VectorVest RealTime Derby Tool
- VectorVest Simulator
- VectorVest Variator
- VectorVest Watchdog
- StockCharts.com, Inc.
- Candle Patterns
- Candlestick Charting Explained
- Intermarket Technical Analysis
- John Murphy on Chart Analysis
- John Murphy's Chart Pattern Recognition
- John Murphy's Market Message
- MurphyExplainsMarketAnalysis-Intermarket Analysis
- MurphyExplainsMarketAnalysis-Visual Analysis
- StockCharts.com
- Technical Analysis of the Financial Markets
- The Visual Investor
