HOT TOPICS LIST
- MACD
- Fibonacci
- RSI
- Gann
- ADXR
- Stochastics
- Volume
- Triangles
- Futures
- Cycles
- Volatility
- ZIGZAG
- MESA
- Retracement
- Aroon
INDICATORS LIST
LIST OF TOPICS
PRINT THIS ARTICLE
by Paolo Pezzutti
The stock is testing the lower trendline of a channel that contains prices during the past months' downtrend.
Position: N/A
Paolo Pezzutti
Author of the book "Trading the US Markets - A Comprehensive Guide to US Markets for International Traders and Investors" - Harriman House (July 2008)
PRINT THIS ARTICLE
TECHNICAL ANALYSIS
Pfizer Tests Supports
05/30/06 10:24:49 AMby Paolo Pezzutti
The stock is testing the lower trendline of a channel that contains prices during the past months' downtrend.
Position: N/A
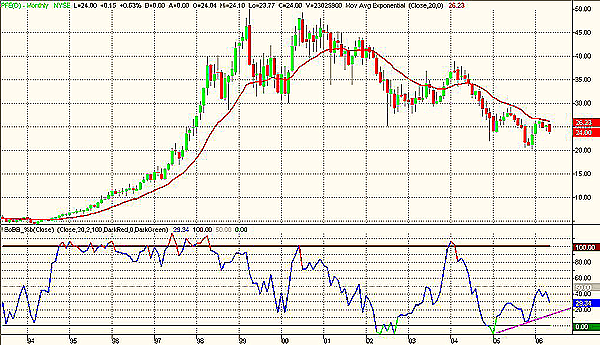
| Pfizer (PFE), the global pharmaceutical company, in the monthly chart in Figure 1 displays how, after the year 2000 top, the stock started a five-year downtrend. The stock did not participate in the last three-year upmove. From the 2000 high of about $48, PFE lost more than 50% to the present $24 level. In Figure 1, I used the Bollinger %b(close), which plots the difference between the close and the lower Bollinger Band. This indicator has printed a positive divergence with the December 2005 low. This fact could indicate the possibility of higher prices in the intermediate term. |

|
| FIGURE 1: PFIZER, MONTHLY. The stock did not take part in the stock market uptrend in 2003. |
| Graphic provided by: TradeStation. |
| |
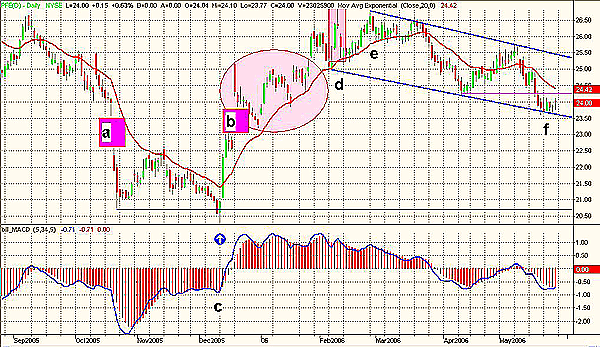
| In the daily time frame (Figure 2), between October and December 2005, the stock has printed a bottom reversal island. The pattern is formed when prices gap lower after an extended decline (exhaustion gap at point A), trade one or more days leaving the gap open, then gap higher (breakaway gap at point B). Such a situation leaves the price action like an island, surrounded by space. The gap to the upside completes the island reversal pattern and usually indicates a trend reversal. The converse is true for island tops. |
| At point C, you can see the positive divergence printed by the moving average convergence/divergence (MACD) in coincidence with the new low of December 12, 2005. This phase is interesting because it also presents a turtle soup plus one setup. Prices printed a new 20-day low on December 11, but the next day reentered the previous range, exploding to the upside. The exit of this trade could have occurred a few days later, applying a trailing stop, or ideally, at the open gap of December 19! Profits must be locked in when applying this technique. |

|
| FIGURE 2: PFIZER, DAILY. The stock is testing its supports. The MACD is not confirming the new low. Prices could move toward the upper trendline. |
| Graphic provided by: TradeStation. |
| |
| The stock developed an ascending triangle and, following that, at point D, a three-bar bearish candlestick formation that was printed with a negative divergence of MACD. That was the sign that investors' attitude was changing. At point E, after the failure of the retest of the resistance associated with another negative divergence of MACD, prices initiated a downtrend in this time frame. |
| Currently, at point F, the stock is testing the support represented by the lower trendline of a decreasing channel that contained the price move since last February. The new low is being printed with lack of momentum and a congestion is being developed in the form of a flag. These short-term formations normally indicate a continuation of the original trend. A negative sign would be provided by the closure of the breakaway gap of point B at $23. It is true that buying on support represents a general common sense rule, but in this case, before entering a long position I would wait for a short-term reversal formation to reduce risks. As it is not possible to forecast the outcome of technical situations when trading, the difference is made by risk management and identification of good risk/reward setups. |
Author of the book "Trading the US Markets - A Comprehensive Guide to US Markets for International Traders and Investors" - Harriman House (July 2008)
| Address: | VIA ROBERTO AGO 26 POSTAL CODE 00166 |
| Rome, ITALY | |
| Phone # for sales: | +393357540708 |
| E-mail address: | pezzutti.paolo@tiscali.it |
Click here for more information about our publications!
Comments
Date: 05/30/06Rank: 3Comment:

Request Information From Our Sponsors
- VectorVest, Inc.
- Executive Premier Workshop
- One-Day Options Course
- OptionsPro
- Retirement Income Workshop
- Sure-Fire Trading Systems (VectorVest, Inc.)
- Trading as a Business Workshop
- VectorVest 7 EOD
- VectorVest 7 RealTime/IntraDay
- VectorVest AutoTester
- VectorVest Educational Services
- VectorVest OnLine
- VectorVest Options Analyzer
- VectorVest ProGraphics v6.0
- VectorVest ProTrader 7
- VectorVest RealTime Derby Tool
- VectorVest Simulator
- VectorVest Variator
- VectorVest Watchdog
- StockCharts.com, Inc.
- Candle Patterns
- Candlestick Charting Explained
- Intermarket Technical Analysis
- John Murphy on Chart Analysis
- John Murphy's Chart Pattern Recognition
- John Murphy's Market Message
- MurphyExplainsMarketAnalysis-Intermarket Analysis
- MurphyExplainsMarketAnalysis-Visual Analysis
- StockCharts.com
- Technical Analysis of the Financial Markets
- The Visual Investor
