HOT TOPICS LIST
- MACD
- Fibonacci
- RSI
- Gann
- ADXR
- Stochastics
- Volume
- Triangles
- Futures
- Cycles
- Volatility
- ZIGZAG
- MESA
- Retracement
- Aroon
INDICATORS LIST
LIST OF TOPICS
PRINT THIS ARTICLE
by David Penn
Bouncing off the lows as gold suffers through a major correction, how much upside does the greenback have left?
Position: N/A
David Penn
Technical Writer for Technical Analysis of STOCKS & COMMODITIES magazine, Working-Money.com, and Traders.com Advantage.
PRINT THIS ARTICLE
REVERSAL
Dancin' Days For The Dollar?
05/26/06 02:58:44 PMby David Penn
Bouncing off the lows as gold suffers through a major correction, how much upside does the greenback have left?
Position: N/A
| At the beginning of the month, I wrote an article for Traders.com Advantage outlining the scenario for a bullish phase in the US dollar ("Death To The Death Of The Dollar," May 1, 2006). Specifically, I was looking at a head & shoulders bottom—a sizable one, at that—which had the capacity to drive the greenback to as high as 105 on a successful breakout. Most critical to that effort, I wrote, would be the index's ability to remain above 81—the low point of the prospective head & shoulders bottom. Had the dollar fallen below this level, then not only would the head & shoulders bottom pattern been proved invalid, but also a new low for the dollar's seemingly endless bear market would have been achieved. |

|
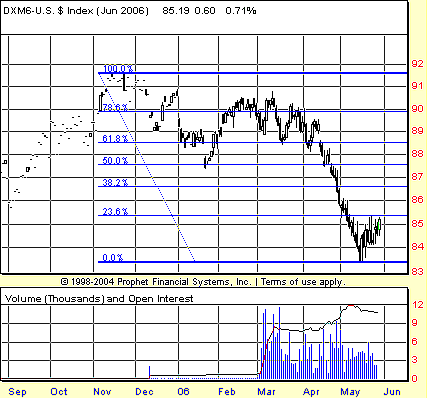
| FIGURE 1: JUNE US DOLLAR INDEX, DAILY. The bounce in the greenback has yet to retrace so much as a Fibonacci 38.2%. Should the greenback achieve this, it is worth noting that there is no significant technical resistance until the 50% mark, with the real resistance looming still higher near the 61.8% Fibonacci retracement level. |
| Graphic provided by: Prophet Financial, Inc. |
| |
| If the current bounce is any indication, then the dollar has avoided that fate, at least for the time being. Basis June, the US Dollar Index fell to approximately 83.5 in mid-May and made its strongest upward movement since March. As Figure 1 shows, however, the bounce in the second half of May has done little to repair the technical damage from the dollar's fall from 91.5 in November 2005 to 83.5 in May 2006. A standard bounce after a drop like the one that occurred in the dollar could be expected to retrace somewhere in the neighborhood of the Fibonacci 38.2% level. A greenback that failed to move higher from current levels, that failed, for example, to even reach the 38.2% retracement level, would be a weak greenback indeed. |
| Other than being "oversold" (and if you're familiar with my Working-Money.com article "BOSO," then you know what I think about "oversold" markets!), what are the grounds for any bounce in the US Dollar Index at these levels? There is technical support in the form of the April 2005 lows around 83.3–83.4 (basis continuous futures) that matches up with where the greenback at least temporarily has rebounded. Looking closer at a chart of the June futures, however, shows us other technical sources for the dollar's recent strength. |

|
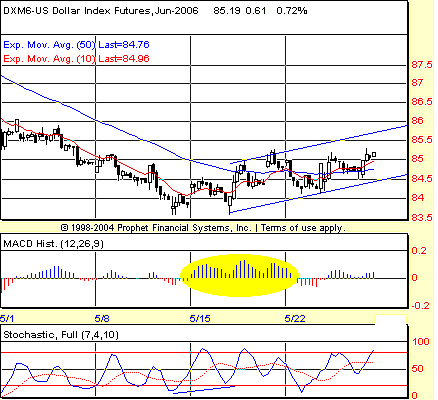
| FIGURE 2: JUNE US DOLLAR INDEX, 90-MINUTE. A positive stochastic divergence in this 90-minute chart of the DXM6 is among the clues that the greenback would head higher in late May. Note also the size of the MACD histogram in mid-May. Positive extremes in the MACD histogram during a bounce after an extended correction are often signs of higher prices to come. |
| Graphic provided by: Prophet Financial, Inc. |
| |
| These other technical sources include a look at a 90-minute chart (Figure 2), as well as the stochastic and the moving average convergence/divergence (MACD) histogram. There is a clear positive stochastic divergence in mid-May as the June greenback tested and retested the 83.60 level. The fact that these tests were accompanied by higher lows in the stochastic was one clue that a bottom of some significance was being established (see my Working-Money.com article "Dial D For Divergences," March 8, 2006, for more on using divergences to spot tops and bottoms). Another clue was the strongly positive MACD histogram that developed as the market made its bounce in the second half of May. Such histograms are often excellent signals that a market is ready to higher. Generally speaking, when I come across scenarios in which a MACD histogram extreme positive appears, I look for the market to exceed the price high that accompanies that extreme. |
| Another potential positive for the argument for higher prices in the greenback is the fact that it has so far moved up while well-contained in a trend channel. Often, when a market begins to rally from a bottom, it will advance first in an initial trend channel, then break out above that channel and into a new, more aggressively bullish trend channel. What is taking place, I believe, with the development of such trend channels is that the first channel represents the smart money, whereas the second trend channel represents the shift in sentiment in favor of that market. Of course, not every reversal to the upside follows this pattern. But it occurs often enough for traders to be aware of it when it appears. |
Technical Writer for Technical Analysis of STOCKS & COMMODITIES magazine, Working-Money.com, and Traders.com Advantage.
| Title: | Technical Writer |
| Company: | Technical Analysis, Inc. |
| Address: | 4757 California Avenue SW |
| Seattle, WA 98116 | |
| Phone # for sales: | 206 938 0570 |
| Fax: | 206 938 1307 |
| Website: | www.Traders.com |
| E-mail address: | DPenn@traders.com |
Traders' Resource Links | |
| Charting the Stock Market: The Wyckoff Method -- Books | |
| Working-Money.com -- Online Trading Services | |
| Traders.com Advantage -- Online Trading Services | |
| Technical Analysis of Stocks & Commodities -- Publications and Newsletters | |
| Working Money, at Working-Money.com -- Publications and Newsletters | |
| Traders.com Advantage -- Publications and Newsletters | |
| Professional Traders Starter Kit -- Software | |
Click here for more information about our publications!
Comments
Date: 05/26/06Rank: 3Comment:

Request Information From Our Sponsors
- StockCharts.com, Inc.
- Candle Patterns
- Candlestick Charting Explained
- Intermarket Technical Analysis
- John Murphy on Chart Analysis
- John Murphy's Chart Pattern Recognition
- John Murphy's Market Message
- MurphyExplainsMarketAnalysis-Intermarket Analysis
- MurphyExplainsMarketAnalysis-Visual Analysis
- StockCharts.com
- Technical Analysis of the Financial Markets
- The Visual Investor
- VectorVest, Inc.
- Executive Premier Workshop
- One-Day Options Course
- OptionsPro
- Retirement Income Workshop
- Sure-Fire Trading Systems (VectorVest, Inc.)
- Trading as a Business Workshop
- VectorVest 7 EOD
- VectorVest 7 RealTime/IntraDay
- VectorVest AutoTester
- VectorVest Educational Services
- VectorVest OnLine
- VectorVest Options Analyzer
- VectorVest ProGraphics v6.0
- VectorVest ProTrader 7
- VectorVest RealTime Derby Tool
- VectorVest Simulator
- VectorVest Variator
- VectorVest Watchdog
