HOT TOPICS LIST
- MACD
- Fibonacci
- RSI
- Gann
- ADXR
- Stochastics
- Volume
- Triangles
- Futures
- Cycles
- Volatility
- ZIGZAG
- MESA
- Retracement
- Aroon
INDICATORS LIST
LIST OF TOPICS
PRINT THIS ARTICLE
by Gary Grosschadl
The TSX Gold Index reflects the current uncertainty of where gold is headed next. It's caught in an "EMA sandwich."
Position: Hold
Gary Grosschadl
Independent Canadian equities trader and technical analyst based in Peterborough
Ontario, Canada.
PRINT THIS ARTICLE
MOVING AVERAGES
A Golden Sandwich
05/26/06 02:46:58 PMby Gary Grosschadl
The TSX Gold Index reflects the current uncertainty of where gold is headed next. It's caught in an "EMA sandwich."
Position: Hold
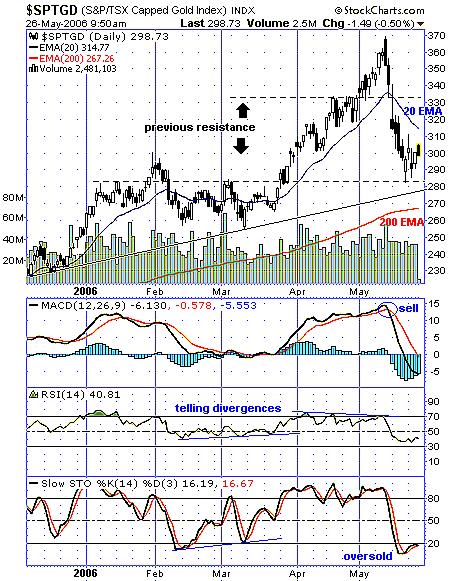
| Figure 1 is a daily chart of this gold index, called Standard & Poor's/TSX (Toronto) Capped Gold Index. Here, the chart shows the index suspended between support and resistance. Currently, it is bouncing off a previous resistance level, which may be thwarted by two overhead marks. |
| Along with the previous levels marked on the chart, the index can be seen as sandwiched between two prominent moving averages, namely the 20-day and 200-day exponential MAs. The 200-day EMA would be a major support level currently at 267. As the index is still above this mark, the longer-term trend is still bullish. The short-term outlook is bearish via the 20-day EMA. After a significant rise, a move below this moving average often heralds a downleg. |

|
| FIGURE 1: THE TORONTO GOLD INDEX, DAILY. This gold index is suspended between support and resistance. |
| Graphic provided by: StockCharts.com. |
| |
| Under these conditions, short-term traders could adopt the following strategies: 1. Assume the stock/index is in failure mode until it closes above the 20-day EMA, therefore staying out of the market or being on the "short" side. 2. Play the bounce off any future move off either the 200-day EMA or the nearby trendline at 280. Then the sell target becomes the overhead resistance at the 20-day EMA. |
| Several indicators are noted below the chart: The moving average convergence/divergence (MACD) gave a timely sell signal near the peak of the uptrend. Likewise, the buy signal comes with a similar crossover from these low levels. The relative strength index (RSI) is in bearish territory below 50. Note the good divergence signals previously plotted: a positive divergence to price action before the upleg and the negative divergence as the index was rising. The stochastic oscillator also shows a similar divergence and is now in oversold territory. A move above 20 on this oscillator could signal the next upleg. |
| In conclusion, the next significant move may come with a resolution of this EMA sandwich, be it a move below or above the EMAs I mentioned or a timely future bounce of the 200-day EMA support. |
Independent Canadian equities trader and technical analyst based in Peterborough
Ontario, Canada.
| Website: | www.whatsonsale.ca/financial.html |
| E-mail address: | gwg7@sympatico.ca |
Click here for more information about our publications!
Comments
Date: 05/26/06Rank: 5Comment:
Date: 05/30/06Rank: 4Comment:

Request Information From Our Sponsors
- StockCharts.com, Inc.
- Candle Patterns
- Candlestick Charting Explained
- Intermarket Technical Analysis
- John Murphy on Chart Analysis
- John Murphy's Chart Pattern Recognition
- John Murphy's Market Message
- MurphyExplainsMarketAnalysis-Intermarket Analysis
- MurphyExplainsMarketAnalysis-Visual Analysis
- StockCharts.com
- Technical Analysis of the Financial Markets
- The Visual Investor
- VectorVest, Inc.
- Executive Premier Workshop
- One-Day Options Course
- OptionsPro
- Retirement Income Workshop
- Sure-Fire Trading Systems (VectorVest, Inc.)
- Trading as a Business Workshop
- VectorVest 7 EOD
- VectorVest 7 RealTime/IntraDay
- VectorVest AutoTester
- VectorVest Educational Services
- VectorVest OnLine
- VectorVest Options Analyzer
- VectorVest ProGraphics v6.0
- VectorVest ProTrader 7
- VectorVest RealTime Derby Tool
- VectorVest Simulator
- VectorVest Variator
- VectorVest Watchdog
