HOT TOPICS LIST
- MACD
- Fibonacci
- RSI
- Gann
- ADXR
- Stochastics
- Volume
- Triangles
- Futures
- Cycles
- Volatility
- ZIGZAG
- MESA
- Retracement
- Aroon
INDICATORS LIST
LIST OF TOPICS
PRINT THIS ARTICLE
by Gary Grosschadl
A long-term view of this retail giant shows significant downside.
Position: Sell
Gary Grosschadl
Independent Canadian equities trader and technical analyst based in Peterborough
Ontario, Canada.
PRINT THIS ARTICLE
SYMMETRICAL TRIANGLE
Wal-Mart Downside
05/25/06 08:06:43 AMby Gary Grosschadl
A long-term view of this retail giant shows significant downside.
Position: Sell
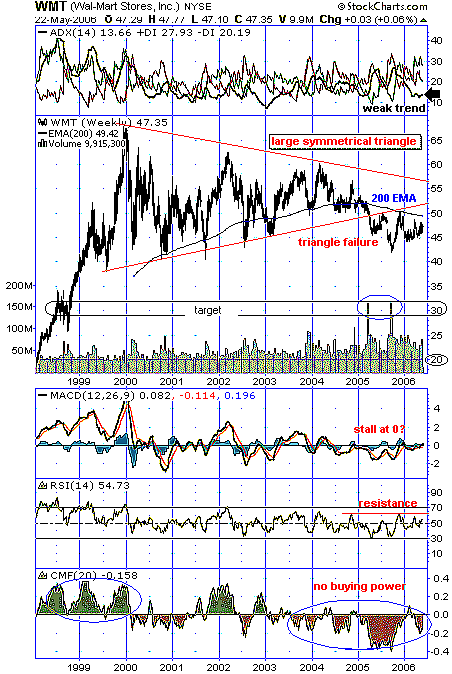
| The eight-year weekly chart (Figure 1) shows a large symmetrical triangle. This formation is neutral, as it can break either way and it has made a downside move. Note the exceptionally large volume spikes after breaking the lower trendline; this lends credence to the downside break. |
| Two targets are suggested. The first is at a previous congestion area around the $30 mark way back in 1999. The second target relates to the pattern failure target. The measured move for a triangle break is equal to the widest distance of the triangle as applied to the downside break of the trendline. This is a $20 target (68-38=30, 50-30=20). These targets are long-term targets and may take some time to evolve. |

|
| FIGURE 1: WAL-MART. A long-term view shows large downside possibility for WMT. |
| Graphic provided by: StockCharts.com. |
| |
| Several indicators are displayed. At the top of Figure 1, the average directional movement index (ADX) shows a weak trend at 13.66. For a strong trend to develop, the ADX should be upsloping and above 20. The moving average convergence/divergence (MACD) is at the potential stall level of zero. A strong trend would entail a sustained move well above or below the zero mark. The relative strength index (RSI) shows a somewhat meandering journey between 30 and 60. A bullish change is unlikely unless the apparent resistance at about the 60 level is broken. The Chaikin money flow indicator (CMF) reflects selling power, very different from the 1998–2000 period, where buying power was very evident. |
| The other significant indication on the chart is the often-watched 200-period moving average (exponential, in this case). Note how this may now be stiff overhead resistance. Once stocks fall below this important moving average, a trend change is often indicated. Until Wal-Mart (WMT) rises above this line, rallies to this overhead resistance are deemed to be bear rallies only. |
| The long-term view paints a bleak picture. Unless Wal-Mart makes a sustained move north of the 200-period EMA, the view from here is bearish. |
Independent Canadian equities trader and technical analyst based in Peterborough
Ontario, Canada.
| Website: | www.whatsonsale.ca/financial.html |
| E-mail address: | gwg7@sympatico.ca |
Click here for more information about our publications!
Comments
Date: 05/25/06Rank: 5Comment:
Date: 05/25/06Rank: 5Comment:
Date: 05/30/06Rank: 4Comment:

Request Information From Our Sponsors
- StockCharts.com, Inc.
- Candle Patterns
- Candlestick Charting Explained
- Intermarket Technical Analysis
- John Murphy on Chart Analysis
- John Murphy's Chart Pattern Recognition
- John Murphy's Market Message
- MurphyExplainsMarketAnalysis-Intermarket Analysis
- MurphyExplainsMarketAnalysis-Visual Analysis
- StockCharts.com
- Technical Analysis of the Financial Markets
- The Visual Investor
- VectorVest, Inc.
- Executive Premier Workshop
- One-Day Options Course
- OptionsPro
- Retirement Income Workshop
- Sure-Fire Trading Systems (VectorVest, Inc.)
- Trading as a Business Workshop
- VectorVest 7 EOD
- VectorVest 7 RealTime/IntraDay
- VectorVest AutoTester
- VectorVest Educational Services
- VectorVest OnLine
- VectorVest Options Analyzer
- VectorVest ProGraphics v6.0
- VectorVest ProTrader 7
- VectorVest RealTime Derby Tool
- VectorVest Simulator
- VectorVest Variator
- VectorVest Watchdog
