HOT TOPICS LIST
- MACD
- Fibonacci
- RSI
- Gann
- ADXR
- Stochastics
- Volume
- Triangles
- Futures
- Cycles
- Volatility
- ZIGZAG
- MESA
- Retracement
- Aroon
INDICATORS LIST
LIST OF TOPICS
PRINT THIS ARTICLE
by David Penn
Negative divergences in the Russell 2000 signaled the potential for weakness in late May.
Position: N/A
David Penn
Technical Writer for Technical Analysis of STOCKS & COMMODITIES magazine, Working-Money.com, and Traders.com Advantage.
PRINT THIS ARTICLE
REVERSAL
Doomed By The Divergence
05/24/06 12:38:10 PMby David Penn
Negative divergences in the Russell 2000 signaled the potential for weakness in late May.
Position: N/A
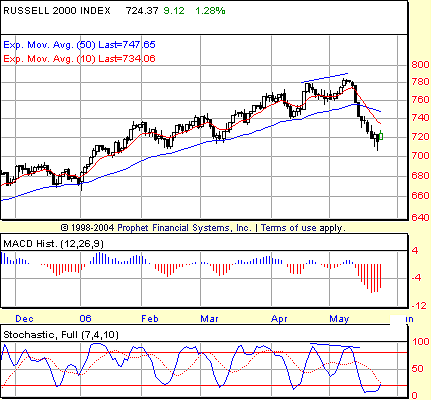
| In an article for Working-Money.com, I pointed out that the relative strength in consumer staples stocks suggested that an economic slowdown was increasingly likely in the second half of 2006 ("Counting On Consumers," May 1, 2006). That both the Russell 2000 and New York Stock Exchange broke through their intermediate-term trendlines in late May was a clear signal to all who were willing to look that weakness truly was entering the market. See Figure 1. |

|
| FIGURE 1: RUSSELL 2000 INDEX, DAILY. A month-on-month negative stochastic divergence was a classic sign that a market that hadn't experienced a significant correction in months might be about to develop one. |
| Graphic provided by: Prophet Financial, Inc. |
| |
| Not every top is accompanied by a clear negative divergence in a key indicator. But it behooves traders to be alert for negative divergences in markets that, if not necessarily overextended to the upside, have refused to correct themselves with significant downward or even sideways price action. Not every negative divergence is tradable (see my Working-Money.com article on the topic of divergences, "Dial D For Divergences," March 8, 2006), but every negative divergence should be evaluated carefully in its own context. And where those contexts reveal a market with vulnerabilities to the downside, the trader or speculator should be prepared to bet against that market. |
| The negative stochastic divergence in the Russell 2000 was classic. The divergence was month-on-month, ideal for a daily chart, with higher price highs from April to May accompanied by lower stochastic highs. There are a couple of different ways of "confirming" the divergence. One is simply to wait for prices to fall below the low of the earlier/lower of the two price highs. This is the method I outlined in an article for Working-Money.com ("Confirming Divergences," December 22, 2004). The other method is to use the moving average convergence/divergence (MACD) histogram—or rather, a downshift in the MACD histogram—as a trigger. |

|
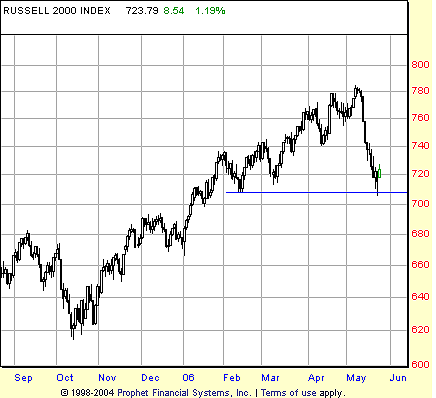
| FIGURE 2: RUSSELL 2000, DAILY. The correction in the Russell 2000 in May took out three months' worth of higher lows in a matter of days. On a closing basis, however, the February lows remain a source of support for the time being. |
| Graphic provided by: Prophet Financial, Inc. |
| |
| I've written a great deal about this approach in articles for Traders.com Advantage. Using the Russell 2000 as our market, we look for the first time the MACD histogram makes a lower high after the stochastic divergence is clear. By "clear," I mean that the second lower peak in the stochastic indicator has to be made; the line needs to roll over to form a peak. The day (or session) of that lower high in the MACD histogram is the key day. Take half the range of that day and subtract it from the low of that day. That number is the target entry level to the downside (a number I call "the point," from the world of craps). |
| Let's take a look at how this very precise method worked. Based on my readings from my daily Prophet.net chart, the stochastic made a lower high on May 9. The very next day, the MACD histogram made a lower high. That day, May 10, was the "key day," with a range of 7.94. Divide that in half to get 3.97, and subtract 3.97 from the low of the day (772.75) for a point or target entry level to the downside of 768.78. That point was hit during the massive selloff on May 11—the very next day (Figure 2). The Russell 2000 proceeded to fall for another seven sessions, never making so much as an intraday higher high. With a standard trailing stop, a short based on this negative divergence would have been stopped out on the morning of May 23 with a $RUT print at 722.54—some 46-odd points later. |
Technical Writer for Technical Analysis of STOCKS & COMMODITIES magazine, Working-Money.com, and Traders.com Advantage.
| Title: | Technical Writer |
| Company: | Technical Analysis, Inc. |
| Address: | 4757 California Avenue SW |
| Seattle, WA 98116 | |
| Phone # for sales: | 206 938 0570 |
| Fax: | 206 938 1307 |
| Website: | www.Traders.com |
| E-mail address: | DPenn@traders.com |
Traders' Resource Links | |
| Charting the Stock Market: The Wyckoff Method -- Books | |
| Working-Money.com -- Online Trading Services | |
| Traders.com Advantage -- Online Trading Services | |
| Technical Analysis of Stocks & Commodities -- Publications and Newsletters | |
| Working Money, at Working-Money.com -- Publications and Newsletters | |
| Traders.com Advantage -- Publications and Newsletters | |
| Professional Traders Starter Kit -- Software | |
Click here for more information about our publications!
Comments
Date: 05/24/06Rank: 3Comment:
Date: 05/25/06Rank: 3Comment:
Date: 05/28/06Rank: 2Comment: Ah, hindsight is so clear isn t it. Why didn t you print this article the day you got the sell signal? It would have been a 100x more useful.
Date: 05/29/06Rank: 4Comment:

Request Information From Our Sponsors
- StockCharts.com, Inc.
- Candle Patterns
- Candlestick Charting Explained
- Intermarket Technical Analysis
- John Murphy on Chart Analysis
- John Murphy's Chart Pattern Recognition
- John Murphy's Market Message
- MurphyExplainsMarketAnalysis-Intermarket Analysis
- MurphyExplainsMarketAnalysis-Visual Analysis
- StockCharts.com
- Technical Analysis of the Financial Markets
- The Visual Investor
- VectorVest, Inc.
- Executive Premier Workshop
- One-Day Options Course
- OptionsPro
- Retirement Income Workshop
- Sure-Fire Trading Systems (VectorVest, Inc.)
- Trading as a Business Workshop
- VectorVest 7 EOD
- VectorVest 7 RealTime/IntraDay
- VectorVest AutoTester
- VectorVest Educational Services
- VectorVest OnLine
- VectorVest Options Analyzer
- VectorVest ProGraphics v6.0
- VectorVest ProTrader 7
- VectorVest RealTime Derby Tool
- VectorVest Simulator
- VectorVest Variator
- VectorVest Watchdog
