HOT TOPICS LIST
- MACD
- Fibonacci
- RSI
- Gann
- ADXR
- Stochastics
- Volume
- Triangles
- Futures
- Cycles
- Volatility
- ZIGZAG
- MESA
- Retracement
- Aroon
INDICATORS LIST
LIST OF TOPICS
PRINT THIS ARTICLE
by David Penn
Where will the falling Philadelphia Semiconductor Index find support?
Position: N/A
David Penn
Technical Writer for Technical Analysis of STOCKS & COMMODITIES magazine, Working-Money.com, and Traders.com Advantage.
PRINT THIS ARTICLE
FIBONACCI
Fibonacci, Trading Ranges, And A Semiconductor Bounce
05/23/06 08:24:29 AMby David Penn
Where will the falling Philadelphia Semiconductor Index find support?
Position: N/A
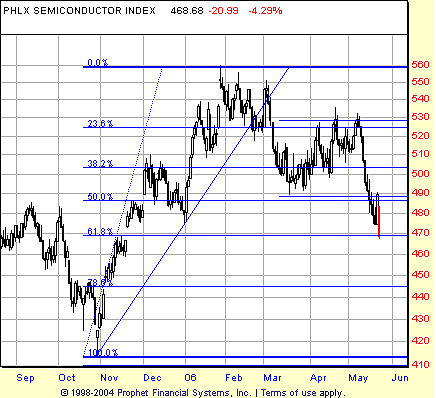
| It is now clear that the Philadelphia Semiconductor Index ($SOX) has just experienced a classic 1-2-3 trend reversal (Figure 1). Rallying from the late October 2005 lows, the $SOX ran from about 420 to just above 550 by late January 2006. The index slipped below the trendline that supported this advance in late February and rallied back above the trendline in earliest March. But the true break occurred a few days later as the $SOX slashed below two months' worth of lows (February and January). |

|
| FIGURE 1: PHILADELPHIA SEMICONDUCTOR INDEX, DAILY. A 1-2-3 correction helps take "the socks" from January highs near 560 to May lows near 470. The size of the consolidation after the trendline break suggests downside to the 450 level. |
| Graphic provided by: Prophet Financial, Inc. |
| |
| These mid-March lows established the lower end of the decisive trading range that would let traders know if the trend that began in October had likely been reversed. This low is considered the #1 step in the 1-2-3 trend reversal. The #2 step would occur as the $SOX attempted to reverse its slide and challenge for new highs. This effort took place over the spring of 2006--from the March lows to the highs in early May. In fact, that May 2006 high represents #2: the high point of the post-correction bounce. |
| Mid-May brought traders and investors in semiconductor stocks to step #3. During this final stage in the 1-2-3 trend reversal, the market failed to set a new high with step #2 and, instead, broke down below the lows established with step #1. Looking at $SOX in Figure 1, we see that shortly after step #3, the $SOX bounced sharply in a single-session, short-covering shock with options expiration-enhanced volatility. However, the Monday following this "bounce" saw the $SOX powerfully on the decline once again, losing more than 4% in a single day. If we grant the close of trading on May 15 as the entry point for a trader shorting the $SOX according to the 1-2-3 trend reversal method (an entry at 486.97, with May 15 being the date that the $SOX closed below the #1 post trendline break low of 489.31 on March 17), then we still have a profitable speculation to the downside in semiconductors. |

|
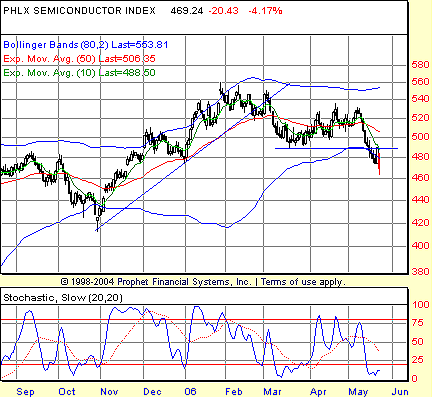
| FIGURE 2: PHILADELPHIA SEMICONDUCTOR INDEX, DAILY. The Bollinger Bands here show how volatility contracted after the initial trendline break, only to expand again during the mid-May breakdown. |
| Graphic provided by: Prophet Financial, Inc. |
| |
| As I suggested in a recent article on the NASDAQ 100 ("Trading Ranges," May 19, 2006) for Traders.com Advantage, the size of the trading range that developed after the trendline break might be instructive in determining how far down the $SOX will fall (Figure 2). Note also that in Figure 1, I applied Fibonacci retracement levels to see how well current support levels correspond to Fibonacci levels. Note, for example, that support for the consolidation lies around the 50% retracement level, and that the current decline in #3 has reached the 61.8% retracement level. |
| Generally speaking, the 61.8% retracement level would be an excellent spot for a falling market to bounce. However, the width of the trading range from mid-March to early May suggests a downside of some 40 points beyond the lower boundary of the range. With a lower boundary at approximately 490, this means a minimum downside of 450 for the $SOX--which is closer to a 78.6% retracement than a 61.8% retracement. Insofar as the market for semiconductors has already attempted a bounce, the path to lower lows increasingly appears to the path of least (support and) resistance. |
Technical Writer for Technical Analysis of STOCKS & COMMODITIES magazine, Working-Money.com, and Traders.com Advantage.
| Title: | Technical Writer |
| Company: | Technical Analysis, Inc. |
| Address: | 4757 California Avenue SW |
| Seattle, WA 98116 | |
| Phone # for sales: | 206 938 0570 |
| Fax: | 206 938 1307 |
| Website: | www.Traders.com |
| E-mail address: | DPenn@traders.com |
Traders' Resource Links | |
| Charting the Stock Market: The Wyckoff Method -- Books | |
| Working-Money.com -- Online Trading Services | |
| Traders.com Advantage -- Online Trading Services | |
| Technical Analysis of Stocks & Commodities -- Publications and Newsletters | |
| Working Money, at Working-Money.com -- Publications and Newsletters | |
| Traders.com Advantage -- Publications and Newsletters | |
| Professional Traders Starter Kit -- Software | |
Click here for more information about our publications!
Comments
Date: 05/23/06Rank: 4Comment:
Date: 05/23/06Rank: 3Comment:
Date: 05/24/06Rank: 4Comment:

|

Request Information From Our Sponsors
- StockCharts.com, Inc.
- Candle Patterns
- Candlestick Charting Explained
- Intermarket Technical Analysis
- John Murphy on Chart Analysis
- John Murphy's Chart Pattern Recognition
- John Murphy's Market Message
- MurphyExplainsMarketAnalysis-Intermarket Analysis
- MurphyExplainsMarketAnalysis-Visual Analysis
- StockCharts.com
- Technical Analysis of the Financial Markets
- The Visual Investor
- VectorVest, Inc.
- Executive Premier Workshop
- One-Day Options Course
- OptionsPro
- Retirement Income Workshop
- Sure-Fire Trading Systems (VectorVest, Inc.)
- Trading as a Business Workshop
- VectorVest 7 EOD
- VectorVest 7 RealTime/IntraDay
- VectorVest AutoTester
- VectorVest Educational Services
- VectorVest OnLine
- VectorVest Options Analyzer
- VectorVest ProGraphics v6.0
- VectorVest ProTrader 7
- VectorVest RealTime Derby Tool
- VectorVest Simulator
- VectorVest Variator
- VectorVest Watchdog
