HOT TOPICS LIST
- MACD
- Fibonacci
- RSI
- Gann
- ADXR
- Stochastics
- Volume
- Triangles
- Futures
- Cycles
- Volatility
- ZIGZAG
- MESA
- Retracement
- Aroon
INDICATORS LIST
LIST OF TOPICS
PRINT THIS ARTICLE
by Koos van der Merwe
Can the volatility index be used to predict market direction?
Position: Accumulate
Koos van der Merwe
Has been a technical analyst since 1969, and has worked as a futures and options trader with First Financial Futures in Johannesburg, South Africa.
PRINT THIS ARTICLE
VOLATILITY
The Volatility Index As A Forecasting Tool
05/24/06 01:30:01 PMby Koos van der Merwe
Can the volatility index be used to predict market direction?
Position: Accumulate
| As a contrarian, I must wonder about this. The general feeling is that the volatility index (VIX) typically moves counter to the S&P benchmark. It rises when investors feel that risk levels are increasing and will bid up index options, and it falls as investors become more confident and complacent about the market. |
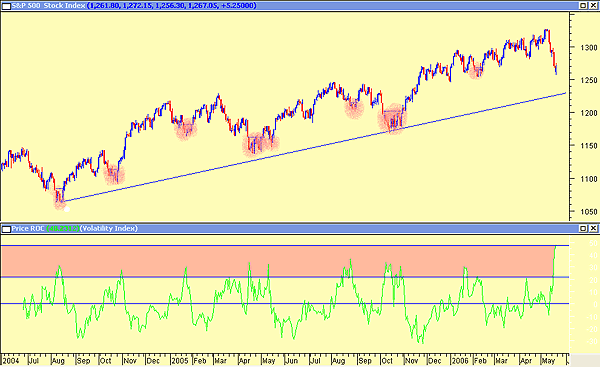
| The VIX is calculated based on prices for Standard & Poor's 500 index options. Because option prices incorporate a premium for volatility, the VIX gives an instant reading on how volatile the investors expect the market to be over the next 30 days. However, its most common and important use is as a measure of investor sentiment. When I want to compare the VIX to the S&P 500, I prefer to look at the VIX rate of change (ROC). Figure 1 is the S&P 500 with a 20% ROC of the VIX drawn beneath it. I have shaded the areas that suggest a change of trend. When the VIX ROC is high, it suggests that a large number of investors are selling, which causes prices to be more volatile than average. The S&P 500 will then fall on high volatility, a scenario that the VIX ROC suggests is a time to buy. Refining timing can be improved by using the ROC of the VIX. A low VIX number, however, implies complacency. Investors are happy to believe the market always goes up and will ignore bad news and warnings. They will overlook high valuations and hold overoptimistic expectations. |

|
| FIGURE 1: S&P 500. Here's the S&P 500 with the ROC of the VIX showing buy zones. |
| Graphic provided by: MetaStock. |
| |
| Figure 1 shows the movement of the VIX ROC relative to the S&P 500 from June 2004. Note how the movement of the ROC of the VIX into the shaded zone on the chart always coincides with a low on the S&P chart. The indicator is suggesting that the S&P 500 could start strengthening in the near future. |
| The ROC of the VIX indicator is an indicator that should be in every analyst's toolbox, along with the other indicators used to determine market direction. |
Has been a technical analyst since 1969, and has worked as a futures and options trader with First Financial Futures in Johannesburg, South Africa.
| Address: | 3256 West 24th Ave |
| Vancouver, BC | |
| Phone # for sales: | 6042634214 |
| E-mail address: | petroosp@gmail.com |
Click here for more information about our publications!
Comments
Date: 05/24/06Rank: 4Comment:
Date: 05/25/06Rank: 5Comment:
Date: 05/25/06Rank: 5Comment:
Date: 05/25/06Rank: 4Comment:

Request Information From Our Sponsors
- VectorVest, Inc.
- Executive Premier Workshop
- One-Day Options Course
- OptionsPro
- Retirement Income Workshop
- Sure-Fire Trading Systems (VectorVest, Inc.)
- Trading as a Business Workshop
- VectorVest 7 EOD
- VectorVest 7 RealTime/IntraDay
- VectorVest AutoTester
- VectorVest Educational Services
- VectorVest OnLine
- VectorVest Options Analyzer
- VectorVest ProGraphics v6.0
- VectorVest ProTrader 7
- VectorVest RealTime Derby Tool
- VectorVest Simulator
- VectorVest Variator
- VectorVest Watchdog
- StockCharts.com, Inc.
- Candle Patterns
- Candlestick Charting Explained
- Intermarket Technical Analysis
- John Murphy on Chart Analysis
- John Murphy's Chart Pattern Recognition
- John Murphy's Market Message
- MurphyExplainsMarketAnalysis-Intermarket Analysis
- MurphyExplainsMarketAnalysis-Visual Analysis
- StockCharts.com
- Technical Analysis of the Financial Markets
- The Visual Investor
