HOT TOPICS LIST
- MACD
- Fibonacci
- RSI
- Gann
- ADXR
- Stochastics
- Volume
- Triangles
- Futures
- Cycles
- Volatility
- ZIGZAG
- MESA
- Retracement
- Aroon
INDICATORS LIST
LIST OF TOPICS
PRINT THIS ARTICLE
by Koos van der Merwe
Is the recent strength in the Canadian dollar a type I or a type II move?
Position: Sell
Koos van der Merwe
Has been a technical analyst since 1969, and has worked as a futures and options trader with First Financial Futures in Johannesburg, South Africa.
PRINT THIS ARTICLE
GANN
The Canadian Dollar
05/23/06 08:00:47 AMby Koos van der Merwe
Is the recent strength in the Canadian dollar a type I or a type II move?
Position: Sell
| What does the recent strength in the Canadian dollar indicate? A type I move is when the strength of the Canadian dollar is the result of a strong economy; there may be an increase in interest rates, when investors look for a higher rate in bonds and therefore buy Canadian dollars to purchase those bonds; or when the money supply diminishes as the Bank of Canada fights inflation. In contrast, a type II move occurs when the Canadian dollar strengthens against the US dollar not because of a type I reason, but because of a US dollar weakness. |
| With the recent strength in the price of gold and the rise in the price of oil, the Canadian dollar has strengthened from a low of 0.6203 to the US dollar in January 2002 to the recent high of 0.9084 on May 5, 2006. This increase has resulted in many analysts calling for parity with the US dollar in the very near future. However, there are those who believe that the Canadian dollar will settle at lower levels and base their forecast on reducing exports, caused by the stronger Canadian dollar. With a falling oil price and commodities weakening, cash flowing into Canada from the US will also start falling. Consider that the price of oil remains a constant when compared to a basket of currencies... the stronger US dollar relative to the Canadian dollar means fewer US dollars flowing into Canada to purchase the same quantity of oil. We should not forget that the US is Canada's largest trading partner. All right, so this explanation is simplistic, and you, the reader, should spend time on your own researching and understanding in greater depth opinions by various economists who all have two hands. Charts, however, are a much simpler way of attempting to forecast the trend. |

|
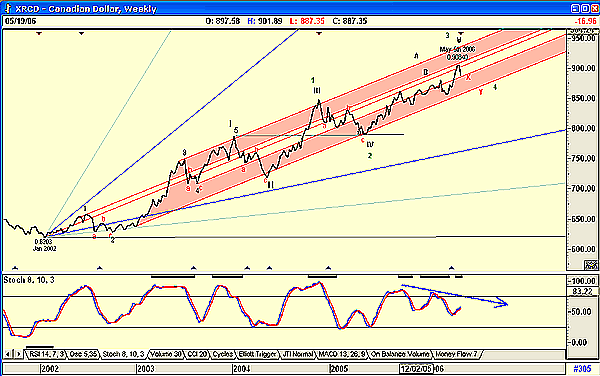
| FIGURE 1: CANADIAN DOLLAR, WEEKLY. This chart of the Canadian dollar shows buy and sell zones. |
| Graphic provided by: AdvancedGET. |
| Graphic provided by: Snagit. |
| |
| Figure 1 is a weekly chart of the Canadian dollar. In the chart, I have shown the low of 0.6203 reached by the Canadian dollar on January 2002. From that date, the C$ has moved up steadily in a difficult wave count. I write "difficult," because although I am showing a wave count on the chart, I am not that happy with it. A wave 5 that is much longer than the wave 3 is disturbing, which suggests that the alternate count shown in green could be possible. The latter suggests that the Canadian dollar could indeed reach parity with the US dollar, if not exceed it. This suggests that the US dollar could weaken drastically. |
| Figure 1 also shows a Gann fan, with parallel lines drawn to the 1x1 angle. The lines are drawn off the early highs and lows as shown. This suggests that the falling Canadian dollar could find support somewhere between the X and Y trendlines. This would place it below the 0.90 level, at the 0.86–0.87 level. Is this possible? Yes, should David Dodge, chairman of the Bank of Canada, decide not to increase rates in an attempt to boost the economy. At the moment, he is increasing rates to fight inflation, but the rate increase is also strengthening the Canadian dollar, making Canadian products more expensive on the US market. He must look for a balance, where inflation is controlled and Canadian products are price attractive to the US. (That would be a type I.) The stochastic indicator supports this interpretation by suggesting that the trend is a weaker Canadian dollar. Once the Canadian dollar has reached the X-Y zone, it will start strengthening again. Its support level could be the Y support line. This increase would be caused by a weakening US dollar, a type II scenario, and not any action taken by the BOC. My primary wave count (black) is suggesting that a wave V has still to complete. My secondary wave count (green) is too emotional to consider, because it suggests a total collapse of the US dollar. Two theories in favor of the latter is the uncertainty about the policies of the new chairman of the US Federal Reserve. We should not forget that when Alan Greenspan was appointed Fed chairman by President Ronald Reagan in 1987, the market fell badly. The same could happen with Fed chairman Ben Bernanke. |

|
| |
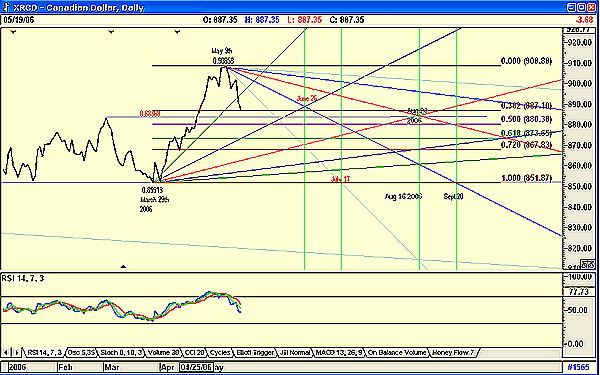
| When we look at the daily chart (Figure 2), I have drawn in Fibonacci retracements suggesting possible support levels. I have also drawn in two Gann fans from the low of March 29, 2006, and the high of May 9. These fans suggest the dates for the possible turning points. The relative strength index (RSI) is confirming weakness. To conclude, the Canadian dollar will weaken relative to the US dollar in the short term. The weakness in the Canadian dollar could be caused by a fall in oil prices or commodity prices (gold, silver, copper, for example), a type I move, or because of weakness in the US economy causing the US dollar to weaken further, a type II move. However, before the end of 2006, it looks as if the Canadian dollar will strengthen to new highs, with parity to the US dollar being a very real possibility. |
Has been a technical analyst since 1969, and has worked as a futures and options trader with First Financial Futures in Johannesburg, South Africa.
| Address: | 3256 West 24th Ave |
| Vancouver, BC | |
| Phone # for sales: | 6042634214 |
| E-mail address: | petroosp@gmail.com |
Click here for more information about our publications!
Comments
Date: 05/23/06Rank: 2Comment:

Request Information From Our Sponsors
- VectorVest, Inc.
- Executive Premier Workshop
- One-Day Options Course
- OptionsPro
- Retirement Income Workshop
- Sure-Fire Trading Systems (VectorVest, Inc.)
- Trading as a Business Workshop
- VectorVest 7 EOD
- VectorVest 7 RealTime/IntraDay
- VectorVest AutoTester
- VectorVest Educational Services
- VectorVest OnLine
- VectorVest Options Analyzer
- VectorVest ProGraphics v6.0
- VectorVest ProTrader 7
- VectorVest RealTime Derby Tool
- VectorVest Simulator
- VectorVest Variator
- VectorVest Watchdog
- StockCharts.com, Inc.
- Candle Patterns
- Candlestick Charting Explained
- Intermarket Technical Analysis
- John Murphy on Chart Analysis
- John Murphy's Chart Pattern Recognition
- John Murphy's Market Message
- MurphyExplainsMarketAnalysis-Intermarket Analysis
- MurphyExplainsMarketAnalysis-Visual Analysis
- StockCharts.com
- Technical Analysis of the Financial Markets
- The Visual Investor
