HOT TOPICS LIST
- MACD
- Fibonacci
- RSI
- Gann
- ADXR
- Stochastics
- Volume
- Triangles
- Futures
- Cycles
- Volatility
- ZIGZAG
- MESA
- Retracement
- Aroon
INDICATORS LIST
LIST OF TOPICS
PRINT THIS ARTICLE
by Luis Ferro
The formation of a hammer pattern has bullish implications in the short term. An Elliott wave theory triangle in the medium-term trend strengthens the chances that sugar prices will go up.
Position: Buy
Luis Ferro
Trader and technical analyst living in Bern, Switzerland. A full member of the STA, currently enrolled in the DITA program and the CMT program.
PRINT THIS ARTICLE
ELLIOTT WAVE
Hammer And Triangle For Sugar
05/22/06 11:17:54 AMby Luis Ferro
The formation of a hammer pattern has bullish implications in the short term. An Elliott wave theory triangle in the medium-term trend strengthens the chances that sugar prices will go up.
Position: Buy
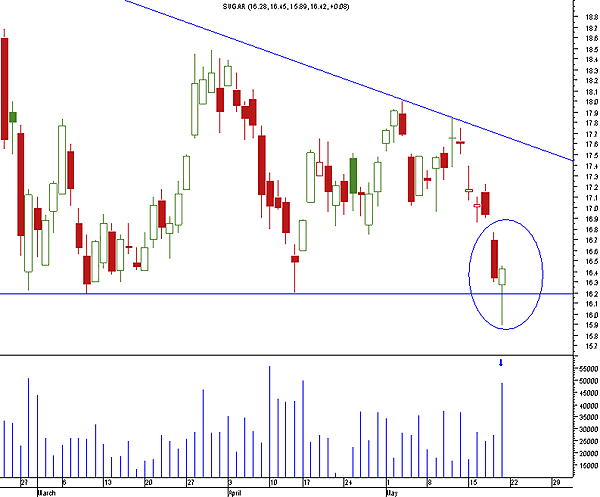
| In the daily chart (Figure 1), we can see that in the last trading day, sugar formed a candlestick pattern known as a hammer. Hammers are important candlestick reversal patterns, formed when a candle has a long lower shadow, a relatively small body (normally, the shadow should be twice or more the size of the body), and a small or nonexistent upper shadow. It can be considered either bullish, if it appears following a downtrend, or bearish, if it forms after a rally, and in that case, it is referred to as a hanging man. In this case, the hammer must be considered bullish because it was formed following a downtrend. |

|
| FIGURE 1: SUGAR, DAILY. The last trading day in sugar shows a hammer candlestick pattern formed. |
| Graphic provided by: MetaStock. |
| |
| There are three factors that increase the strength of this particular hammer. First, the body of the hammer is white, since the close was above the open, and white hammers are considered more bullish than black ones. Second, volume was very high on the day of the hammer; it was actually the day with the highest volume since more than a month. Third, the hammer was formed at a previous support level that had already been touched twice. Prices were able to penetrate below the 16.2 level, but quickly reversed and closed above it. Sugar will probably increase now, since the support level has withstood the test. |

|
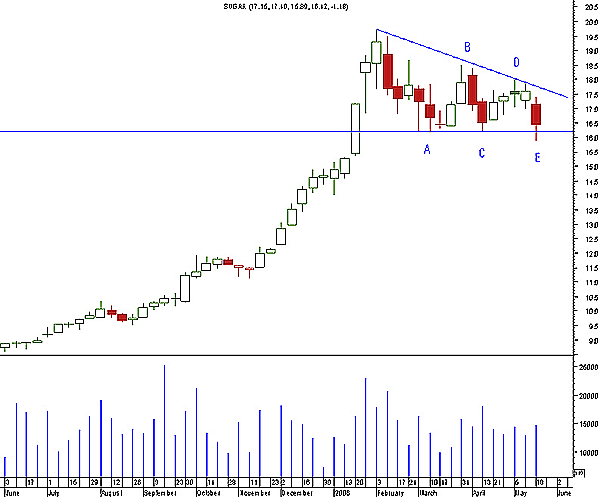
| FIGURE 2: SUGAR, WEEKLY. Here, prices are in a congestion pattern with the lower limit defined by a horizontal support level and the upper limit a descending trendline. |
| Graphic provided by: MetaStock. |
| |
| The weekly chart of sugar (Figure 2) shows that the prices are in a congestion pattern with the lower limit defined by a horizontal support level and the upper limit defined by a descending trendline. In Elliott wave theory, this specific type of congestion is called a contracting triangle. Elliott wave triangles differ from traditional technical analysis triangles because they always have an internal 5 wave structure (labeled A, B, C, D, and E, with wave E being the terminal wave). In the case of sugar, the waves are very clearly defined. Another important characteristic is that Elliott triangles are always fourth waves, so they are essentially bullish, because following the completion of the triangle, prices are supposed to rally and complete the fifth wave. |
| In the case of sugar, there is a combination of bullish patterns, both in the short and medium term, and these are normally the best trading setups. The current price action suggests two levels to place a stop. The first could be just below the 16.2 support level, but since prices have already penetrated slightly below that level, the best stop is probably just below the low of the hammer at 15.87. As for target prices, the minimum would be a retest of the top at 19.73. Supposing the trade is entered close to the close of the hammer at 16.42, the risk will be 0.55. If prices reach 19.73, the profit will be 3.31. Thus, the risk/reward relationship is 6 to1. This is a risk well worth taking. |
Trader and technical analyst living in Bern, Switzerland. A full member of the STA, currently enrolled in the DITA program and the CMT program.
| Address: | Switzerland |
| E-mail address: | luispgsf@yahoo.com |
Click here for more information about our publications!
Comments
Date: 05/22/06Rank: 3Comment:

Request Information From Our Sponsors
- StockCharts.com, Inc.
- Candle Patterns
- Candlestick Charting Explained
- Intermarket Technical Analysis
- John Murphy on Chart Analysis
- John Murphy's Chart Pattern Recognition
- John Murphy's Market Message
- MurphyExplainsMarketAnalysis-Intermarket Analysis
- MurphyExplainsMarketAnalysis-Visual Analysis
- StockCharts.com
- Technical Analysis of the Financial Markets
- The Visual Investor
- VectorVest, Inc.
- Executive Premier Workshop
- One-Day Options Course
- OptionsPro
- Retirement Income Workshop
- Sure-Fire Trading Systems (VectorVest, Inc.)
- Trading as a Business Workshop
- VectorVest 7 EOD
- VectorVest 7 RealTime/IntraDay
- VectorVest AutoTester
- VectorVest Educational Services
- VectorVest OnLine
- VectorVest Options Analyzer
- VectorVest ProGraphics v6.0
- VectorVest ProTrader 7
- VectorVest RealTime Derby Tool
- VectorVest Simulator
- VectorVest Variator
- VectorVest Watchdog
