HOT TOPICS LIST
- MACD
- Fibonacci
- RSI
- Gann
- ADXR
- Stochastics
- Volume
- Triangles
- Futures
- Cycles
- Volatility
- ZIGZAG
- MESA
- Retracement
- Aroon
INDICATORS LIST
LIST OF TOPICS
PRINT THIS ARTICLE
by David Penn
After spending most of 1999 in a trading range, Target finally seems to have made up its mind. Next stop: down.
Position: N/A
David Penn
Technical Writer for Technical Analysis of STOCKS & COMMODITIES magazine, Working-Money.com, and Traders.com Advantage.
PRINT THIS ARTICLE
TECHNICAL ANALYSIS
Target Takes a Time Out
09/12/00 03:04:29 PMby David Penn
After spending most of 1999 in a trading range, Target finally seems to have made up its mind. Next stop: down.
Position: N/A
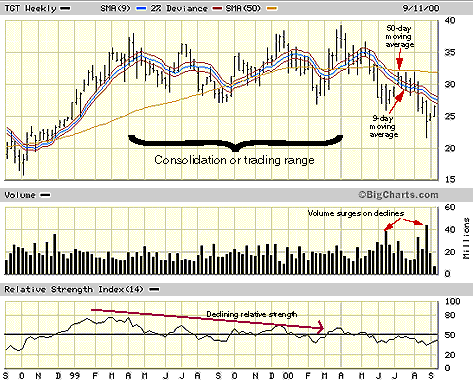
| For all but the first few months of 1999 and most of 2000, Target's stock was the archetype of ambivalence, as prices wandered back and forth between a high of 37 and a low of 27. For the first half of 2000, this wandering appeared as if it would continue almost indefinitely. But with a high of around 37 in April, Target began a descent that took almost 15 points out of the stock by mid-August. |
| Seeds of Target's decline were planted at the close of 1999, when Target began intersecting its 50-day moving average line. The highs of December 1999 and April 2000 brought shares of Target up, but Target spent the month of June 2000 underperforming both its 50- and 9-day moving averages. Shares rallied during July, but were unable to move upside of the 50-day moving average line. And as August arrived, Target was once again lagging behind both averages as prices dipped as low as 22 by the middle of the month. |

|
| Note how prices have fallen beneath both 50- and 9-day moving averages on increased volume. The relative strength index has also been declining. |
| Graphic provided by: Big Charts. |
| |
| Volume also depicts a bearish outlook. The nearly 40 million shares that traded in mid-July 2000 accompanied Target's first downside crossing of its 9-day moving average line since February. And above average trading volumes at the end of August accompanied Target's first close beneath 25 since December 1998. In fact, on the very last day of August, volume of 22 million shares took Target down three dollars to a close of 23. While stock prices are certainly capable of falling under their own weight, 22 million share volumes for a stock that usually moves on volumes of 3-4 million shares suggests that major gravitational forces may have Target's stock by the ankles. |
| A glance at the relative strength index confirms the likelihood of Target's fall. The relative strength index suggested growing weakness during Target's 1999 consolidation range that increased during 2000. The relative strength index measures both the likelihood that a security is overbought or oversold, as well as indicating how current prices compare with recent price performance. The weakness during 1999 for Target is shown here by the declining peaks in the relative strength index itself. The high in the relative strength index was reached in April 1999. A lower peak is registered in July 1999, and a still lower peak in mid-December 1999. This trend of lower peaks continues relatively unbroken into 2000 and, when cast against Target's consolidation period, suggests that Target was becoming technically weaker during the consolidation, not stronger. |
| Note that all numbers reflect a 2-for-1 stock split Target made in July 2000. Much of Target's price behavior--from 1998 climb to 1999 consolidation to what looks like a growing bear market beginning in April 2000--is to be understood in the context of a growing company whose stock price became perhaps a bit overvalued and is now being corrected. As such, the possibility that Target will run into some short-term bearish ground is not synonymous with a crisis for the company. The question that arises is: how much will Target investors let the stock price fall before they begin bidding prices back up? The healthy volume during Target's year-long consolidation suggests that while there may be many who are now willing to sell, there may be a comparable number of those who see bargains where others see profits. |
Technical Writer for Technical Analysis of STOCKS & COMMODITIES magazine, Working-Money.com, and Traders.com Advantage.
| Title: | Technical Writer |
| Company: | Technical Analysis, Inc. |
| Address: | 4757 California Avenue SW |
| Seattle, WA 98116 | |
| Phone # for sales: | 206 938 0570 |
| Fax: | 206 938 1307 |
| Website: | www.Traders.com |
| E-mail address: | DPenn@traders.com |
Traders' Resource Links | |
| Charting the Stock Market: The Wyckoff Method -- Books | |
| Working-Money.com -- Online Trading Services | |
| Traders.com Advantage -- Online Trading Services | |
| Technical Analysis of Stocks & Commodities -- Publications and Newsletters | |
| Working Money, at Working-Money.com -- Publications and Newsletters | |
| Traders.com Advantage -- Publications and Newsletters | |
| Professional Traders Starter Kit -- Software | |
Click here for more information about our publications!
Comments

Request Information From Our Sponsors
- StockCharts.com, Inc.
- Candle Patterns
- Candlestick Charting Explained
- Intermarket Technical Analysis
- John Murphy on Chart Analysis
- John Murphy's Chart Pattern Recognition
- John Murphy's Market Message
- MurphyExplainsMarketAnalysis-Intermarket Analysis
- MurphyExplainsMarketAnalysis-Visual Analysis
- StockCharts.com
- Technical Analysis of the Financial Markets
- The Visual Investor
- VectorVest, Inc.
- Executive Premier Workshop
- One-Day Options Course
- OptionsPro
- Retirement Income Workshop
- Sure-Fire Trading Systems (VectorVest, Inc.)
- Trading as a Business Workshop
- VectorVest 7 EOD
- VectorVest 7 RealTime/IntraDay
- VectorVest AutoTester
- VectorVest Educational Services
- VectorVest OnLine
- VectorVest Options Analyzer
- VectorVest ProGraphics v6.0
- VectorVest ProTrader 7
- VectorVest RealTime Derby Tool
- VectorVest Simulator
- VectorVest Variator
- VectorVest Watchdog
