HOT TOPICS LIST
- MACD
- Fibonacci
- RSI
- Gann
- ADXR
- Stochastics
- Volume
- Triangles
- Futures
- Cycles
- Volatility
- ZIGZAG
- MESA
- Retracement
- Aroon
INDICATORS LIST
LIST OF TOPICS
PRINT THIS ARTICLE
by Paolo Pezzutti
The stock is in an uptrend and is outperforming the stock market.
Position: Accumulate
Paolo Pezzutti
Author of the book "Trading the US Markets - A Comprehensive Guide to US Markets for International Traders and Investors" - Harriman House (July 2008)
PRINT THIS ARTICLE
ON BALANCE VOLUME
Disney Tests Resistance
05/22/06 02:14:28 PMby Paolo Pezzutti
The stock is in an uptrend and is outperforming the stock market.
Position: Accumulate
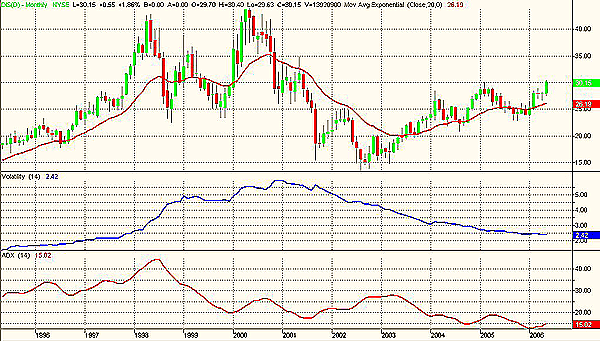
| In the long term (Figure 1), Disney (DIS) started an uptrend at the beginning of the 1990s. From the $10 level, the price reached $42.80 in May 1998. The retest of this high in May 2000 was a failure and printed a double top. Prices started a deep correction until the low of $13.48 at the end of August 2002. During the past three years, prices doubled and are now at the highest level since 2001. Volatility has been going down throughout the period. The average directional movement index (ADX) is printing a low value of 15.02. You would expect to see an increase in volatility in this time frame, although these phases of low volatility and low directionality can be quite long. |

|
| FIGURE 1: DISNEY, MONTHLY. Low volatility and low directionality have characterized the last four years. |
| Graphic provided by: TradeStation. |
| |
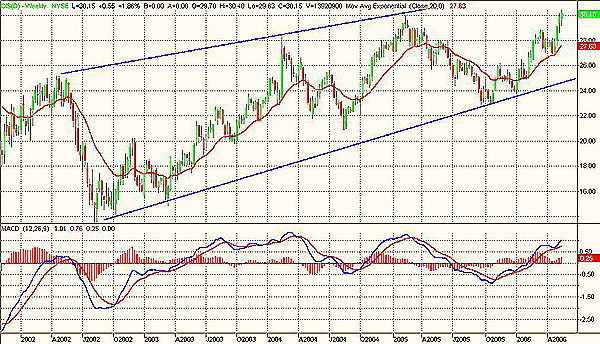
| At the weekly level (Figure 2), prices during the past three years moved upward in a positively inclined channel. The trendlines that limit the large channel are converging. Prices are now testing the resistance at $30. The moving average convergence/divergence (MACD) is positive and prints positive indications of momentum to the upside. In addition, the ADX, above 30, indicates that the stock is in an uptrend. Next resistance, which is represented by the upper trendline, is at $32.50. |

|
| FIGURE 2: DISNEY, WEEKLY. The stock is moving within a positively inclined channel. It is testing the important resistance at $30. |
| Graphic provided by: TradeStation. |
| |
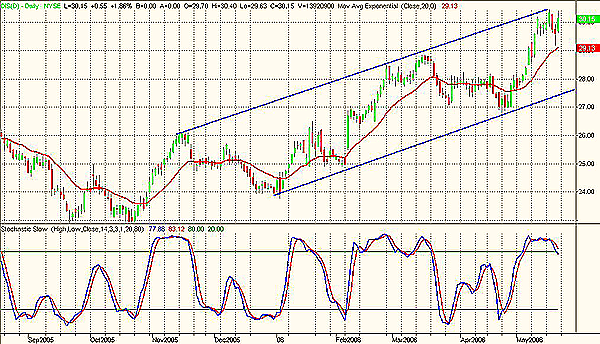
| In the daily chart (Figure 3), you can see that since November 2005 prices have been moving within a positively inclined channel. In six months, the stock gained about 30%. The stochastic slow in this phase has provided few false signals and helped identifying the entry points during the uptrend. At the moment, the oscillator has left the overbought area providing a sell signal, while prices are testing the upper trendline. Risk of opening a long trade is higher at these levels. However, the stock has presented high relative strength with regards to the market in general. This is a very positive indication about the possibility of new highs. |

|
| FIGURE 3: DISNEY, DAILY. Disney has reached the upper trendline and the Stochastic has turned down crossing the overbought line. |
| Graphic provided by: TradeStation. |
| |
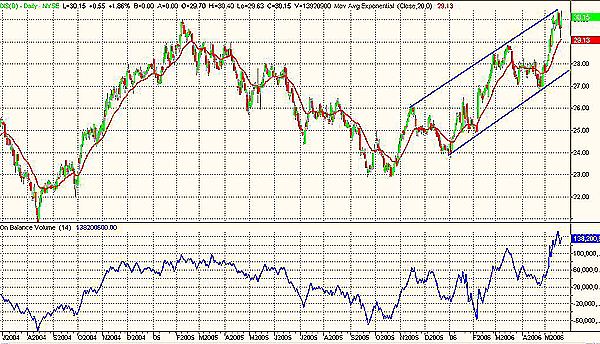
| In Figure 4, you see the on-balance volume (OBV) indicator, which adds to a running total the volume of each bar with a higher close than the bar before and subtracts from the total the volume of each bar with a lower close. The use of both price and volume provides an interesting perspective. Higher prices with light volume will cause OBV to rise slowly, possibly indicating that the trend lacks conviction. You can see that accumulation is ongoing with the stock, with the OBV printing new highs. This has to be taken into account when considering the chances that Disney has to break out from the significant resistance of $30 in the intermediate term. |

|
| FIGURE 4: DISNEY, DAILY. The on-balance volume indicates that accumulation is ongoing in the stock. |
| Graphic provided by: TradeStation. |
| |
| The stock has an interesting potential to the upside. It is displaying strength in a phase of weakness of the stock market. Accumulation is pushing the stock higher. However, prices are now at an important resistance level and entering a long position in this situation, presenting higher risks. There are different trading options. You might either enter the trade applying strict money management rules and stop-loss, in anticipation of a successful breakout, or wait for the breakout to occur and enter the trade at the first pullback should it occur. As an alternative, accumulation on weakness is another option. |
Author of the book "Trading the US Markets - A Comprehensive Guide to US Markets for International Traders and Investors" - Harriman House (July 2008)
| Address: | VIA ROBERTO AGO 26 POSTAL CODE 00166 |
| Rome, ITALY | |
| Phone # for sales: | +393357540708 |
| E-mail address: | pezzutti.paolo@tiscali.it |
Click here for more information about our publications!
Comments
Date: 05/22/06Rank: 3Comment:
Date: 05/24/06Rank: 5Comment:

|

Request Information From Our Sponsors
- StockCharts.com, Inc.
- Candle Patterns
- Candlestick Charting Explained
- Intermarket Technical Analysis
- John Murphy on Chart Analysis
- John Murphy's Chart Pattern Recognition
- John Murphy's Market Message
- MurphyExplainsMarketAnalysis-Intermarket Analysis
- MurphyExplainsMarketAnalysis-Visual Analysis
- StockCharts.com
- Technical Analysis of the Financial Markets
- The Visual Investor
- VectorVest, Inc.
- Executive Premier Workshop
- One-Day Options Course
- OptionsPro
- Retirement Income Workshop
- Sure-Fire Trading Systems (VectorVest, Inc.)
- Trading as a Business Workshop
- VectorVest 7 EOD
- VectorVest 7 RealTime/IntraDay
- VectorVest AutoTester
- VectorVest Educational Services
- VectorVest OnLine
- VectorVest Options Analyzer
- VectorVest ProGraphics v6.0
- VectorVest ProTrader 7
- VectorVest RealTime Derby Tool
- VectorVest Simulator
- VectorVest Variator
- VectorVest Watchdog
