HOT TOPICS LIST
- MACD
- Fibonacci
- RSI
- Gann
- ADXR
- Stochastics
- Volume
- Triangles
- Futures
- Cycles
- Volatility
- ZIGZAG
- MESA
- Retracement
- Aroon
INDICATORS LIST
LIST OF TOPICS
PRINT THIS ARTICLE
by Paolo Pezzutti
The stock has developed an interesting bullish reversal pattern, although general market conditions are negative.
Position: N/A
Paolo Pezzutti
Author of the book "Trading the US Markets - A Comprehensive Guide to US Markets for International Traders and Investors" - Harriman House (July 2008)
PRINT THIS ARTICLE
REVERSAL
JetBlue Airways: Short-Term Reversal
05/22/06 02:10:05 PMby Paolo Pezzutti
The stock has developed an interesting bullish reversal pattern, although general market conditions are negative.
Position: N/A
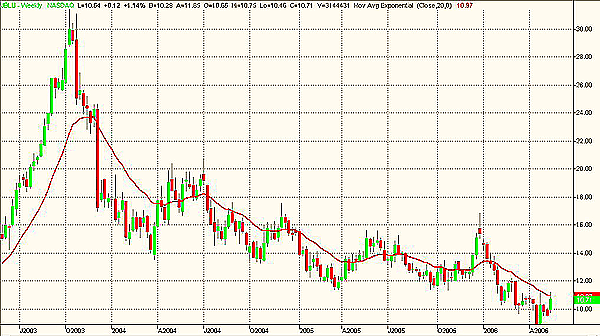
| JetBlue is a low-fare, low-cost passenger airline that provides high-quality customer service primarily on point-to-point routes. The company serves large metropolitan areas that have high average fares. In the marketplace, the stock has provided a poor performance during the past years. In the weekly chart (Figure 1), you can see that, after the top of $31.43 in October 2003, prices have initiated a long downtrend. The stochastic (not shown) has now crossed above the oversold line, indicating the possibility of higher prices in this time frame. |

|
| FIGURE 1: JET BLUE, WEEKLY. JBLU has been in a downtrend since 2003. |
| Graphic provided by: TradeStation. |
| |
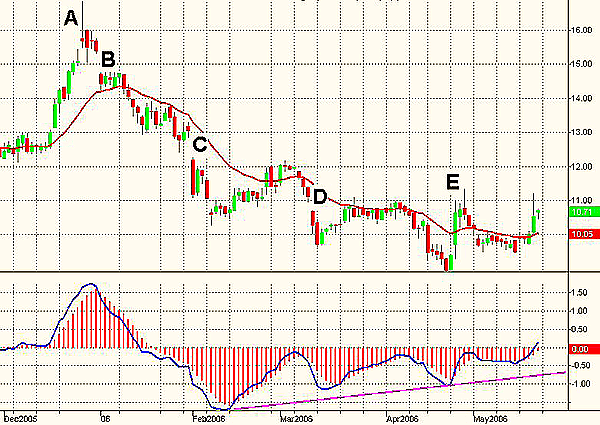
| In the daily chart (Figure 2), you can see the top printed on December 27, 2005 (point A). That high-volatility day closed very near the open and the low of the trading session. Following that, a downtrend started characterized by a series of gaps. A breakaway gap was printed at point B, which occurs when prices leave a blank area with no trading activity, and the market breaks out into a new trend move. Next to that, a continuation gap (point C) indicated the trend acceleration. This gap is also called a runaway or measuring gap, because in theory, the expected price movement is supposed to be roughly equivalent to the part of the trend that occurred prior to the gap. During a trend, you may see a series of continuation gaps in the chart. Finally, an exhaustion gap (point D) was printed after an extended trend. The market continued lower for some days and was followed by a trend reversal. In addition, the asset started to have moving average convergence/divergence (MACD) positive divergences. |

|
| FIGURE 2: JET BLUE, DAILY. The stock has printed consecutive positive divergences of MACD. |
| Graphic provided by: TradeStation. |
| |
| This interesting environment was providing information about a market that was losing steam to the downside. On April 25, JetBlue (JBLU) printed a wide-ranging day to the upside (point E). This pattern is very significant and printed when volatility exceeds the average volatility of the past n days. Printed after a long decline, this pattern can signal the end of the downtrend. A wide-ranging day occurs when the public enters the market, bringing fresh money. It is a strong indication of the future market direction. The high-volatility increase indicates that the market sentiment has shifted quickly from one condition to another, with the public emotionally involved in the trading session. |

|
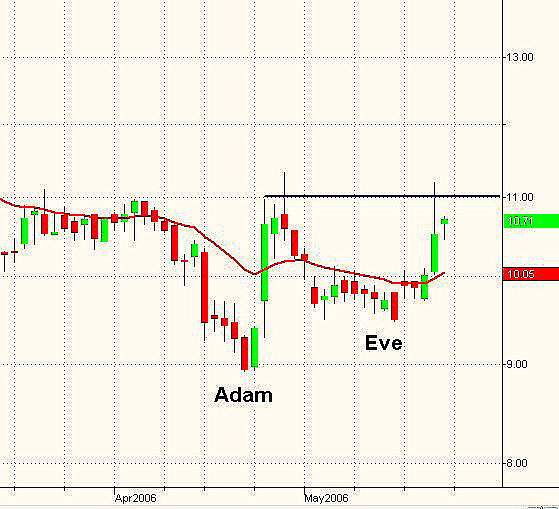
| FIGURE 3: JET BLUE, DAILY. Adam and Eve is a short-term reversal pattern. If the setup is confirmed, the breakout should occur with an increase in volatility. |
| Graphic provided by: TradeStation. |
| |
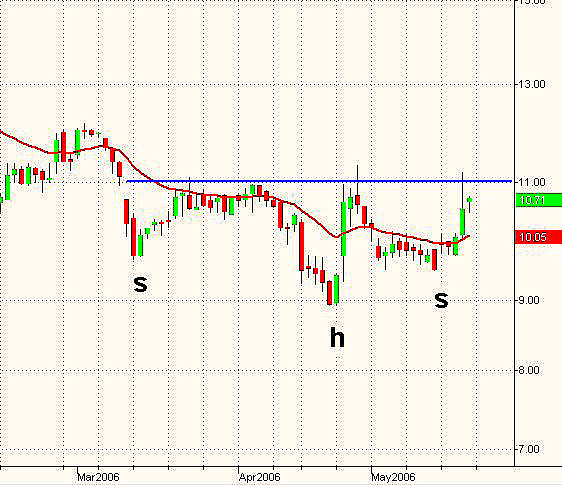
| The next day, JBLU developed an Adam and Eve formation (Figure 3). This pattern is characterized by a sharp and deep first bottom on high volume (Adam). The stock bounces and develops a more gentle correction, printing a second bottom (Eve) on lower volatility. Eve's rounded bottom takes longer to develop than the Adam spike and it is characterized by lower volumes. Price action congests into a tight range and the stock then breaks to the upside. Prices are now testing the top of Eve, which is the resistance at $11. Looking into a wider perspective, the formation developed might also be seen as a bullish head & shoulders (Figure 4). Also in this case, the neckline at $11 is important to confirm the objective of the move, which is positioned at $13. |

|
| FIGURE 4: JET BLUE, DAILY. The objective of the bullish head & shoulders is at $13, should the breakout of the neckline be successful. |
| Graphic provided by: TradeStation. |
| |
| The situation of JetBlue is particularly interesting, because among the airlines index stocks, this is one of the few who present positive technical conditions and print a high relative strength. Giving the particular situation of the market in the short term, you might want to wait for a confirmation of the setups before entering the trade. However, risk has to be controlled and the stop-loss applied with discipline, should you decide to take this trade. |
Author of the book "Trading the US Markets - A Comprehensive Guide to US Markets for International Traders and Investors" - Harriman House (July 2008)
| Address: | VIA ROBERTO AGO 26 POSTAL CODE 00166 |
| Rome, ITALY | |
| Phone # for sales: | +393357540708 |
| E-mail address: | pezzutti.paolo@tiscali.it |
Click here for more information about our publications!
Comments
Date: 05/22/06Rank: 3Comment:

Request Information From Our Sponsors
- VectorVest, Inc.
- Executive Premier Workshop
- One-Day Options Course
- OptionsPro
- Retirement Income Workshop
- Sure-Fire Trading Systems (VectorVest, Inc.)
- Trading as a Business Workshop
- VectorVest 7 EOD
- VectorVest 7 RealTime/IntraDay
- VectorVest AutoTester
- VectorVest Educational Services
- VectorVest OnLine
- VectorVest Options Analyzer
- VectorVest ProGraphics v6.0
- VectorVest ProTrader 7
- VectorVest RealTime Derby Tool
- VectorVest Simulator
- VectorVest Variator
- VectorVest Watchdog
- StockCharts.com, Inc.
- Candle Patterns
- Candlestick Charting Explained
- Intermarket Technical Analysis
- John Murphy on Chart Analysis
- John Murphy's Chart Pattern Recognition
- John Murphy's Market Message
- MurphyExplainsMarketAnalysis-Intermarket Analysis
- MurphyExplainsMarketAnalysis-Visual Analysis
- StockCharts.com
- Technical Analysis of the Financial Markets
- The Visual Investor
