HOT TOPICS LIST
- MACD
- Fibonacci
- RSI
- Gann
- ADXR
- Stochastics
- Volume
- Triangles
- Futures
- Cycles
- Volatility
- ZIGZAG
- MESA
- Retracement
- Aroon
INDICATORS LIST
LIST OF TOPICS
PRINT THIS ARTICLE
by David Penn
Does the NASDAQ 100's recent trading range suggest the magnitude of the move down?
Position: N/A
David Penn
Technical Writer for Technical Analysis of STOCKS & COMMODITIES magazine, Working-Money.com, and Traders.com Advantage.
PRINT THIS ARTICLE
CONSOLID FORMATION
Trading Ranges
05/19/06 01:51:50 PMby David Penn
Does the NASDAQ 100's recent trading range suggest the magnitude of the move down?
Position: N/A
One of my favorite parts of Jack Schwager's must-read book, Market Wizards, comes from Paul Tudor Jones talking about a losing cotton trade. Not only was it one of the first times I read about legendary traders like Jones, but it also gave me a technical tidbit that I've always remembered. The excerpt is a little long to repeat here in its entirety, so I'll simply set it up by saying that Jones was answering a question about a "single trade" that stood out of all the "tens of thousands of trades" he has made in his life. Jones mentions the 1979 cotton market:Jones: ... In an instant I realized that they intended to deliver against the July contract, which then was trading at about a 4-cent premium to the October contract. It also dawned on me that the whole congestion pattern that had formed between 82 and 86 cents was going to be a market measurement for the next move down [the break from 82 cents was going to equal the width of the prior 4-cent trading range]. A classic exchange, as far as I'm concerned. Read the whole interview if you get the chance (heck, you should buy the book!). The technical tidbit, of course, was Jones's belated observation that the size of the congestion range held meaning for the resumption of the previous trend. |

|
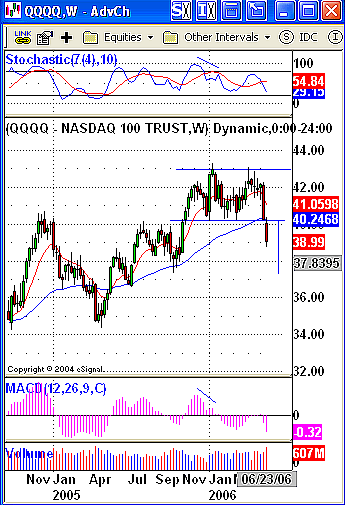
| FIGURE 1: QQQQ, WEEKLY. Negative divergences in both the MACD histogram and the stochastic anticipate a correction in the tracking stock of the NASDAQ 100. The width of the December–May trading range suggests a minimum move below 38. |
| Graphic provided by: eSignal. |
| |
| In this, as I have suggested elsewhere, congestion patterns are little different from other patterns such as triangles, flags, head & shoulders, double tops and bottoms, diamonds and the like. Author Thomas Bulkowski has gone so far as to underscore a "rectangle" as a specific technical chart pattern in the second edition of his book Encyclopedia Of Chart Patterns. Calling them "rectangle tops and rectangle bottoms," Bulkowski has given a certain respectability to what might be a surprisingly common and underexploited chart pattern. |
| "Rectangle top" or "Tudor Congestion," it clearly appears as if the QQQQ has broken down in May from a consolidation that stretches back to December 2005 (Figure 1). This consolidation comes at the end of a bull phase in the QQQQ that has its origins in the lows of August 2004. After bottoming that month just north of 32, the QQQQ rallied sharply to a high just above 40 in November 2004 before retracing a little more than half of its initial rally in a seasonal correction. From about 34.5 in late April 2005, the QQQQ rallied to a high of about 43 by January 2006. The QQQQ corrected again in February before rallying to test the January 2006 high. The January 2006 highs held and the QQQQ began moving downward again, most recently taking out the February 2006 correction low and the 50-day exponential moving average (EMA). |

|
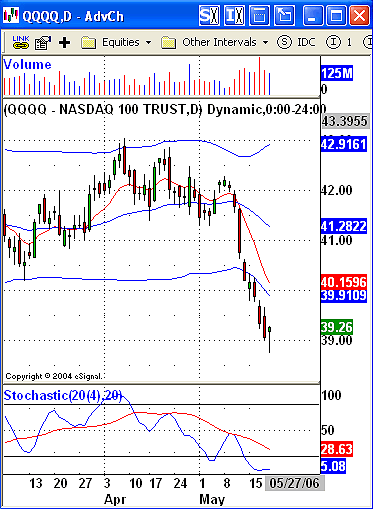
| FIGURE 2: QQQQ, DAILY. Breaking down from a tightened Bollinger Band and slipping into the oversold territory on the stochastic, the QQQQ confirmed a BOSO short signal on May 16. |
| Graphic provided by: eSignal. |
| |
| All this is said to validate the possibility of a top in the QQQQ. Tops need to be preceded by rallies, and the bigger the rally, the more possible it is for a top of some significance to form. Here, we have a QQQQ that was at about 32 in August 2004 that has rallied to just over 43 by January 2006 (a 34% move in about 17 months or about 22-23% annualized), and a fairly good candidate for a top. Note also how negative divergences in the stochastic and the moving average convergence/divergence (MACD) histogram formed just as 2005 was giving way to 2006. This was another warning that the bull market in QQQQ was running out of steam. See Figure 2. |
| The decisiveness of the break below the congestion range cannot be understated. The lower boundary of the congestion range at 40 was a source of true support. This support came not only from the bottom of the range, but also from the top of an earlier congestion range from August to October in 2005, as well as from the end-of-the-year highs in November and December of 2004 and the 50-day EMA. The width of the congestion range — just shy of three points — suggests a minimum move below 37. It is possible that the QQQQ might find at least temporary respite at these levels, matching as they do the lower boundary of that August–October 2005 trading range mentioned. |
Technical Writer for Technical Analysis of STOCKS & COMMODITIES magazine, Working-Money.com, and Traders.com Advantage.
| Title: | Technical Writer |
| Company: | Technical Analysis, Inc. |
| Address: | 4757 California Avenue SW |
| Seattle, WA 98116 | |
| Phone # for sales: | 206 938 0570 |
| Fax: | 206 938 1307 |
| Website: | www.Traders.com |
| E-mail address: | DPenn@traders.com |
Traders' Resource Links | |
| Charting the Stock Market: The Wyckoff Method -- Books | |
| Working-Money.com -- Online Trading Services | |
| Traders.com Advantage -- Online Trading Services | |
| Technical Analysis of Stocks & Commodities -- Publications and Newsletters | |
| Working Money, at Working-Money.com -- Publications and Newsletters | |
| Traders.com Advantage -- Publications and Newsletters | |
| Professional Traders Starter Kit -- Software | |
Click here for more information about our publications!
Comments
Date: 05/19/06Rank: 5Comment:
Date: 05/20/06Rank: 3Comment:
Date: 05/23/06Rank: 5Comment:

Request Information From Our Sponsors
- VectorVest, Inc.
- Executive Premier Workshop
- One-Day Options Course
- OptionsPro
- Retirement Income Workshop
- Sure-Fire Trading Systems (VectorVest, Inc.)
- Trading as a Business Workshop
- VectorVest 7 EOD
- VectorVest 7 RealTime/IntraDay
- VectorVest AutoTester
- VectorVest Educational Services
- VectorVest OnLine
- VectorVest Options Analyzer
- VectorVest ProGraphics v6.0
- VectorVest ProTrader 7
- VectorVest RealTime Derby Tool
- VectorVest Simulator
- VectorVest Variator
- VectorVest Watchdog
- StockCharts.com, Inc.
- Candle Patterns
- Candlestick Charting Explained
- Intermarket Technical Analysis
- John Murphy on Chart Analysis
- John Murphy's Chart Pattern Recognition
- John Murphy's Market Message
- MurphyExplainsMarketAnalysis-Intermarket Analysis
- MurphyExplainsMarketAnalysis-Visual Analysis
- StockCharts.com
- Technical Analysis of the Financial Markets
- The Visual Investor
