HOT TOPICS LIST
- MACD
- Fibonacci
- RSI
- Gann
- ADXR
- Stochastics
- Volume
- Triangles
- Futures
- Cycles
- Volatility
- ZIGZAG
- MESA
- Retracement
- Aroon
INDICATORS LIST
LIST OF TOPICS
PRINT THIS ARTICLE
by David Penn
The first major correction in GOOG found support at one Fibonacci level. Will a subsequent correction in GOOG find support at another?
Position: N/A
David Penn
Technical Writer for Technical Analysis of STOCKS & COMMODITIES magazine, Working-Money.com, and Traders.com Advantage.
PRINT THIS ARTICLE
FIBONACCI
Google And Fibonacci
05/17/06 08:00:33 AMby David Penn
The first major correction in GOOG found support at one Fibonacci level. Will a subsequent correction in GOOG find support at another?
Position: N/A
| Anybody with an Internet connection can find out what you get when you Google "Fibonacci." But what happens when you Fibonacci "Google"? |

|
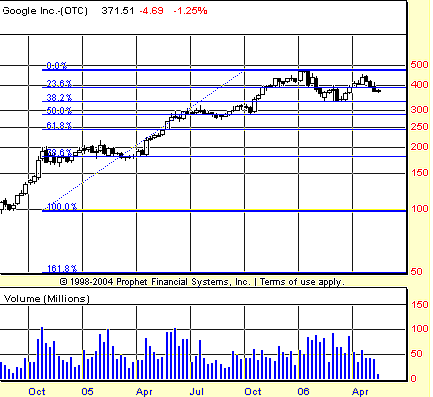
| FIGURE 1: GOOGLE, WEEKLY. The first major correction in GOOG saw the shares retrace fully 38.2% of the stock's advance from August 2004. If GOOG fails to exceed the highs of the second quarter of 2006, then a test of support at 38.2% is likely. A test of support at the second Fibonacci retracement level of 61.8% could follow if support at the 38.2% does not hold. |
| Graphic provided by: Prophet Financial, Inc. |
| |
| Shares of Google were first offered to the investing public by way of an atypical "Dutch auction" at a price of $85 each back in August 2004. Since then, the stock has appreciated tremendously, making a closing high of $469.76 in January 2006 (with an all-time high of $475.11 on January 11). Google has been noteworthy for the mildness of its corrections during this period. After rallying to a weekly closing high of $190.64 in October 2004, the stock moved largely sideways until April 2005, when it broke out and ran to just under $300 by late June. Another sideways consolidation developed shortly afterward. GOOG meandered through this consolidation until it broke out again in October 2005, rallying to its all-time weekly closing high. |
| The correction that struck Google in May 2006, however, was no sideways consolidation. As Figure 1 shows, shares of GOOG fell some 29% from its all-time highs to a weekly closing low of $337.06 -- barely a bump or bruise for those lucking enough to "go Dutch" back in August 2004. But many of those who bought GOOG in the wake of its October 2005 breakout were back to breakeven. From a price perspective, it appears as if Google found support near the top of the last trading range (roughly June to October 2005). However, from the perspective of Fibonacci analysis, it is clear that Google found support at the key Fibonacci support level of 38.2%. See Figure 2. |

|
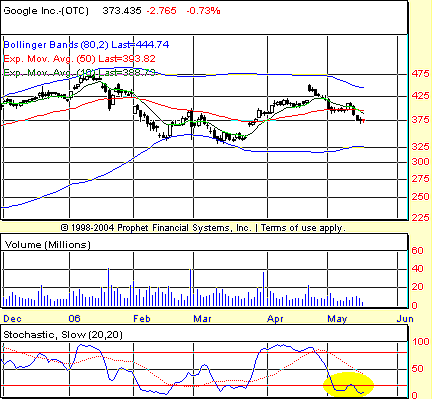
| FIGURE 2: GOOGLE, DAILY. The BOSO screen, which looks for opportunities to buy overbought markets and to sell oversold ones, gave a sell signal in GOOG on May 3 that was confirmed on May 11. |
| Graphic provided by: Prophet Financial, Inc. |
| |
Writing about Fibonacci levels in his book The Visual Investor, author and trader John J. Murphy notes briefly "the [retracement] levels most commonly used are 33 percent, 38 percent, 50 percent, 62 percent, and 66 percent." Later, under the header "Why 28 Percent and 62 Percent," Murphy adds:These two retracement levels are derived from a number series known as the Fibonacci numbers. This series begins with the number 1 and adds each two succeeding numbers together (e.g., 1+1=2, 1+2=3, and so on). The most commonly used Fibonacci numbers are 1, 2, 3, 5, 8, 13, 21, 24, 55, and 89. Fibonacci ratios are very important. The two most important are 38 percent and 62 percent. Each Fibonacci number is approximately 62 percent of the next higher number (e.g., 5/8 = .625); hence, the 62 percent retracement level. 38 is the inverse of 62 (100-62 = 38); hence, the 38 percent retracement number. This is probably all you need to know at this point about these numbers. They are very popular among professional traders and are widely used to determine how far corrections will retrace. |
| What this suggests is many-fold. First, it is little coincidence that Google's first major correction found support at the level it did. That weekly closing low of $337.06 came at precisely a 38.2% retracement of Google's entire advance from the stock's initialy public offering (IPO) to the January 2006 all-time high. Second, this hints at two levels worth watching, should Google be unable to rally above its April 2006 high: a 50% retracement level at about $275 that corresponds also to the bottom of the June to October 2005 trading range and a 61.8% retracement level near $250. Interestingly, the 61.8% retracement level corresponds with little on the chart. The more likely price-generated support does not appear until the top of the November 2004 to April 2005 trading range, and that level is closer to $225 than $250. |
Technical Writer for Technical Analysis of STOCKS & COMMODITIES magazine, Working-Money.com, and Traders.com Advantage.
| Title: | Technical Writer |
| Company: | Technical Analysis, Inc. |
| Address: | 4757 California Avenue SW |
| Seattle, WA 98116 | |
| Phone # for sales: | 206 938 0570 |
| Fax: | 206 938 1307 |
| Website: | www.Traders.com |
| E-mail address: | DPenn@traders.com |
Traders' Resource Links | |
| Charting the Stock Market: The Wyckoff Method -- Books | |
| Working-Money.com -- Online Trading Services | |
| Traders.com Advantage -- Online Trading Services | |
| Technical Analysis of Stocks & Commodities -- Publications and Newsletters | |
| Working Money, at Working-Money.com -- Publications and Newsletters | |
| Traders.com Advantage -- Publications and Newsletters | |
| Professional Traders Starter Kit -- Software | |
Click here for more information about our publications!
Comments
Date: 05/17/06Rank: 3Comment:

Request Information From Our Sponsors
- StockCharts.com, Inc.
- Candle Patterns
- Candlestick Charting Explained
- Intermarket Technical Analysis
- John Murphy on Chart Analysis
- John Murphy's Chart Pattern Recognition
- John Murphy's Market Message
- MurphyExplainsMarketAnalysis-Intermarket Analysis
- MurphyExplainsMarketAnalysis-Visual Analysis
- StockCharts.com
- Technical Analysis of the Financial Markets
- The Visual Investor
- VectorVest, Inc.
- Executive Premier Workshop
- One-Day Options Course
- OptionsPro
- Retirement Income Workshop
- Sure-Fire Trading Systems (VectorVest, Inc.)
- Trading as a Business Workshop
- VectorVest 7 EOD
- VectorVest 7 RealTime/IntraDay
- VectorVest AutoTester
- VectorVest Educational Services
- VectorVest OnLine
- VectorVest Options Analyzer
- VectorVest ProGraphics v6.0
- VectorVest ProTrader 7
- VectorVest RealTime Derby Tool
- VectorVest Simulator
- VectorVest Variator
- VectorVest Watchdog
