HOT TOPICS LIST
- MACD
- Fibonacci
- RSI
- Gann
- ADXR
- Stochastics
- Volume
- Triangles
- Futures
- Cycles
- Volatility
- ZIGZAG
- MESA
- Retracement
- Aroon
INDICATORS LIST
LIST OF TOPICS
PRINT THIS ARTICLE
by Paolo Pezzutti
An impulse to the downside has been printed during the past three sessions, indicating weakness is ahead in the short term.
Position: N/A
Paolo Pezzutti
Author of the book "Trading the US Markets - A Comprehensive Guide to US Markets for International Traders and Investors" - Harriman House (July 2008)
PRINT THIS ARTICLE
TECHNICAL ANALYSIS
Emini NASDAQ Accelerates To The Downside
05/15/06 11:53:23 AMby Paolo Pezzutti
An impulse to the downside has been printed during the past three sessions, indicating weakness is ahead in the short term.
Position: N/A
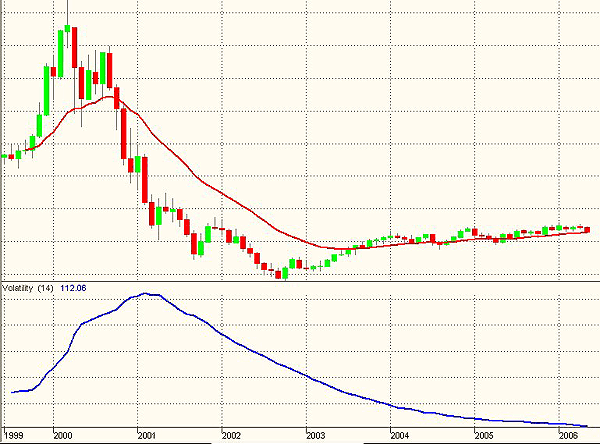
| After the March 2000 high at about 5000, the NASDAQ moved down fast, starting a two-year downtrend and printing a new relative low only in October 2002 at about 885. During the three years since, prices managed to partly recover losses, topping at 1792 in January 2006. The three-year uptrend has been developed with decreasing volatility (Figure 1). In the coming months, I believe we should expect an increase in volatility. |

|
| FIGURE 1: EMINI NASDAQ, MONTHLY. Volatility has been decreasing during the past five years. |
| Graphic provided by: TradeStation. |
| |
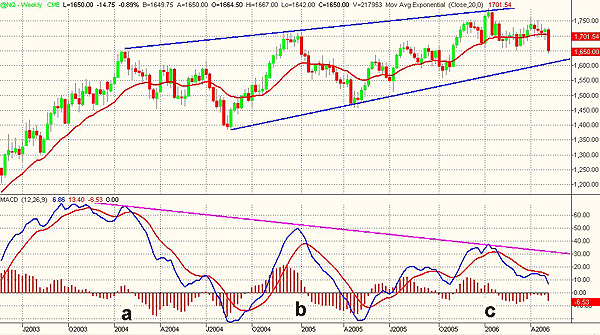
| In the weekly time frame, the moving average convergence/divergence (MACD) indicator has been applied in Figure 2. Since 2004, prices have been moving within a slightly converging channel. The MACD printed negative divergences with the January 2004, December 2004, and January 2006 highs (points A, B, and C). Last January, prices have tested the higher trendline without success. The emini is now correcting quickly. The first support can be identified in the lower rising trendline. |

|
| FIGURE 2: EMINI NASDAQ, WEEKLY. Negative divergences have been printed when testing the upper trendline. |
| Graphic provided by: TradeStation. |
| |
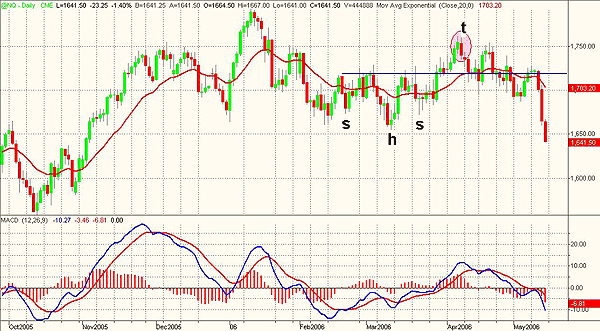
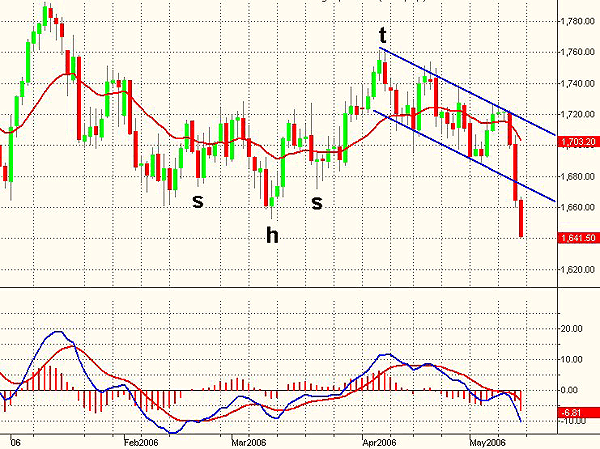
| In the daily time frame (Figure 3), the emini has developed a bullish head & shoulders between February and April. You can see that the breakout of the neckline to the upside occurred on April 30. The market topped on April 7 (point t) and developed a correction move that brought prices below the trendline. The MACD confirmed the lack of momentum and started to print values below its moving average, indicating weakness. Not exactly what you would expect after a breakout. In Figure 4, you can see that prices have moved within a descending channel before the breakout of the lower trendline and the consequent acceleration. This formation was associated to lower MACD prints at each test of the upper trendline. The negative fact is that prices managed to break out from the head of the head & shoulders formation. As you know, these formations are quite reliable. The confirmed failure of the pattern would cause an acceleration of the move. The first objective to the downside is 1600. Trading pattern failures is an interesting technique, one that requires discipline and strong nerves, since moves develop in a high-volatility environment. |

|
| FIGURE 3: EMINI NASDAQ, DAILY. The last trading session printed a breakout of the head & shoulders head. This is an important support. If confirmed, this breakout would bring prices to the 1600 level. |
| Graphic provided by: TradeStation. |
| |
| During the past three sessions, a significant impulse to the downside has been printed. Although it has not had an impact yet on the longer-term trend, it will be quite difficult to resume the uptrend in the short term. It's likely that the sideways phase that has characterized the market since 2004 will continue in the next weeks and months, with prices remaining in the 1750-1500, and lower 1400, trading range. In the daily time frame, the extremely low directionality developed so far might develop in an impulse associated to an increase in volatility with the emini in search of a new valid support. The heavy volume of the past two negative sessions with more than 500,000 contracts indicates the public involvement in the move. Recovering the 1700 level will be key to the possibility to resume the uptrend. In my opinion, bottom-fishing for the moment is premature, and I'd rather wait at least for a short-term reversal pattern. |

|
| FIGURE 4: EMINI NASDAQ, DAILY. The past two sessions printed a breakout to the downside of a decreasing channel that contained prices during the past weeks. |
| Graphic provided by: TradeStation. |
| |
Author of the book "Trading the US Markets - A Comprehensive Guide to US Markets for International Traders and Investors" - Harriman House (July 2008)
| Address: | VIA ROBERTO AGO 26 POSTAL CODE 00166 |
| Rome, ITALY | |
| Phone # for sales: | +393357540708 |
| E-mail address: | pezzutti.paolo@tiscali.it |
Click here for more information about our publications!
Comments
Date: 05/15/06Rank: 3Comment:
Date: 05/15/06Rank: 5Comment:
Date: 05/16/06Rank: 5Comment:
Date: 05/24/06Rank: 5Comment:

Request Information From Our Sponsors
- StockCharts.com, Inc.
- Candle Patterns
- Candlestick Charting Explained
- Intermarket Technical Analysis
- John Murphy on Chart Analysis
- John Murphy's Chart Pattern Recognition
- John Murphy's Market Message
- MurphyExplainsMarketAnalysis-Intermarket Analysis
- MurphyExplainsMarketAnalysis-Visual Analysis
- StockCharts.com
- Technical Analysis of the Financial Markets
- The Visual Investor
- VectorVest, Inc.
- Executive Premier Workshop
- One-Day Options Course
- OptionsPro
- Retirement Income Workshop
- Sure-Fire Trading Systems (VectorVest, Inc.)
- Trading as a Business Workshop
- VectorVest 7 EOD
- VectorVest 7 RealTime/IntraDay
- VectorVest AutoTester
- VectorVest Educational Services
- VectorVest OnLine
- VectorVest Options Analyzer
- VectorVest ProGraphics v6.0
- VectorVest ProTrader 7
- VectorVest RealTime Derby Tool
- VectorVest Simulator
- VectorVest Variator
- VectorVest Watchdog
