HOT TOPICS LIST
- MACD
- Fibonacci
- RSI
- Gann
- ADXR
- Stochastics
- Volume
- Triangles
- Futures
- Cycles
- Volatility
- ZIGZAG
- MESA
- Retracement
- Aroon
INDICATORS LIST
LIST OF TOPICS
PRINT THIS ARTICLE
by Dennis D. Peterson
There are times when the relative strength index (RSI) performs better than the stochastic oscillator, especially at market tops or bottoms.
Position: N/A
Dennis D. Peterson
Market index trading on a daily basis.
PRINT THIS ARTICLE
STOCHASTIC OSCILL
Relative Strength Index Versus Stochastic
09/07/00 12:21:39 PMby Dennis D. Peterson
There are times when the relative strength index (RSI) performs better than the stochastic oscillator, especially at market tops or bottoms.
Position: N/A
| The stochastic oscillator consists of two parts: a %K and a %D line. The formula for %K is (today's close - lowest low in %K periods)/(highest high in %K periods - lowest low in %K periods) X 100. The denominator is a range. It's a bracket. Today's close cannot be higher than the highest high; the most it can be is equal to the highest high. If today's close equals the highest high then %K is 100%. Stochastic can never be greater than 100%. The range bracket assures that, and therein lies it's vulnerability. When a stock or index is moving towards a major top intuitively you would guess that relative to recent action the change should exceed 100%. |
| Relative strength index (RSI) is calculated as 100 - (100/(1+RS)), where RS is the average of x days of upward price change divided by the average of x days of downward price change. Suppose that over the last x days there are no down days. Today's close always results in a positive gain relative to yesterday's close. This means that RS is a large number and RSI will be 100. In reality there is always some retracement while moving up. Using a very short time frame for RSI causes it to vary wider and more quickly. |

|
| Graphic provided by: MetaStock. |
| |
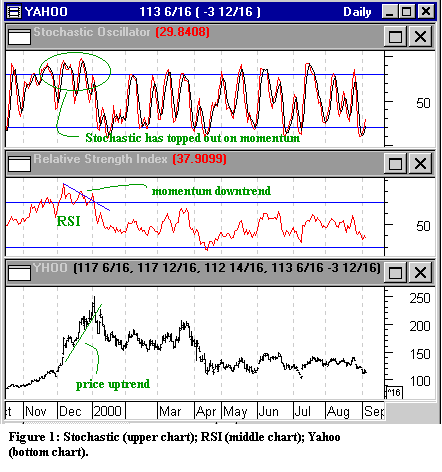
| Figure 1 shows RSI and stochastic for Yahoo (bottom chart). RSI (middle chart) uses a 14-day average. The stochastic (upper chart) is the slow stochastic using a %K of five days, slowing of three days and a %D of three days. Yahoo hit its peak in January 2000. RSI momentum shows a peak a month before. RSI momentum never gets as high again, creating the momentum downtrend. Stochastic on the other hand requires imagination to see a momentum downtrend - it just tops out. Use stochastic in a price channel, or at a time when there is no price trend. |
Market index trading on a daily basis.
| Title: | Staff Writer |
| Company: | Technical Analysis, Inc. |
| Address: | 4757 California Ave SW |
| Seattle, WA 98116-4499 | |
| Phone # for sales: | 206 938 0570 |
| Fax: | 206 938 1307 |
| Website: | www.traders.com |
| E-mail address: | dpeterson@traders.com |
Traders' Resource Links | |
| Charting the Stock Market: The Wyckoff Method -- Books | |
| Working-Money.com -- Online Trading Services | |
| Traders.com Advantage -- Online Trading Services | |
| Technical Analysis of Stocks & Commodities -- Publications and Newsletters | |
| Working Money, at Working-Money.com -- Publications and Newsletters | |
| Traders.com Advantage -- Publications and Newsletters | |
| Professional Traders Starter Kit -- Software | |
Click here for more information about our publications!
Comments

|

Request Information From Our Sponsors
- StockCharts.com, Inc.
- Candle Patterns
- Candlestick Charting Explained
- Intermarket Technical Analysis
- John Murphy on Chart Analysis
- John Murphy's Chart Pattern Recognition
- John Murphy's Market Message
- MurphyExplainsMarketAnalysis-Intermarket Analysis
- MurphyExplainsMarketAnalysis-Visual Analysis
- StockCharts.com
- Technical Analysis of the Financial Markets
- The Visual Investor
- VectorVest, Inc.
- Executive Premier Workshop
- One-Day Options Course
- OptionsPro
- Retirement Income Workshop
- Sure-Fire Trading Systems (VectorVest, Inc.)
- Trading as a Business Workshop
- VectorVest 7 EOD
- VectorVest 7 RealTime/IntraDay
- VectorVest AutoTester
- VectorVest Educational Services
- VectorVest OnLine
- VectorVest Options Analyzer
- VectorVest ProGraphics v6.0
- VectorVest ProTrader 7
- VectorVest RealTime Derby Tool
- VectorVest Simulator
- VectorVest Variator
- VectorVest Watchdog
